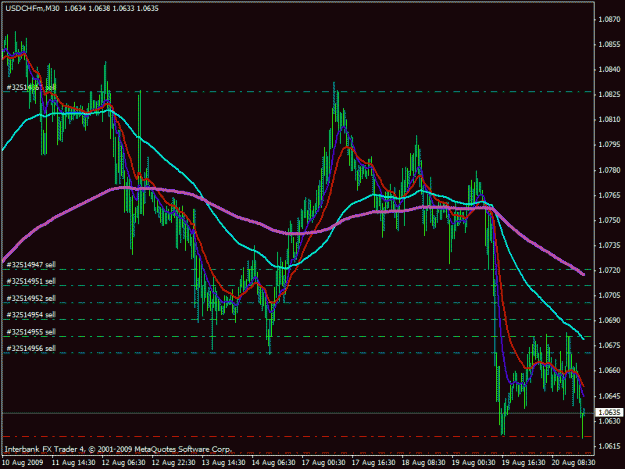
I have noticed that a lot of people pay close attention to the 200SMA on the hour chart and the daily chart as well as the 100SMA 50SMA and 55EMA Etc...
My question is, what are the best moving averages to plot that carry the most significance on a technical basis?
Also, would you recommend having different moving averages for different time frames? I know that if price is near the 200SMA on the hour chart its no where near the 200SMA on the 5min chart. Would there be different moving averages that carry more significance on a shorter time frame as well as a long time frame?
I hope this question makes sense
Thanks
Jeremy
"More important than the quest for certainty is the quest for clarity"