• Home
  • Forums
  • Trades
  • News
  • Calendar
  • Market
  • Brokers
  • Login
  • Join
  • User/Email: Password:
  • 8:29am
Menu
  • Forums
  • Trades
  • News
  • Calendar
  • Market
  • Brokers
  • Login
  • Join
  • 8:29am
Sister Sites
  • Metals Mine
  • Energy EXCH
  • Crypto Craft

Options

Bookmark Thread

First Page First Unread Last Page Last Post

Printable Version

Similar Threads

10 Ema and 200 Ema cross system 6 replies

Simple Indicator Wanted - Pip distance away from EMA 7 replies

indicator that shows distance between 2 ema's increasing/decreasing? 4 replies

Indicator showing price distance from EMA 0 replies

distance between ema's 7 replies

  • Trading Systems
  • /
  • Reply to Thread
  • Subscribe
  • 8
Attachments: Fxt777 EMA Distance System
Exit Attachments

Fxt777 EMA Distance System

  • Post #1
  • Quote
  • First Post: Feb 16, 2007 11:56am Feb 16, 2007 11:56am
  •  fx-trader777
  • Joined Aug 2005 | Status: steady and consistent | 977 Posts
Hello dearest FF members and guests

I have created a system which is not fully tested but looks good so far
I am releasing this system for free.
I think you will be interested because this is a new approach to EMAs. I am sure you have not heard of the similar trading system.
Do not be confused it is not GTS system

Ok here is explanation:

We use 5,10 and 18 EMAs
We use BB Squeeze indicator (indicates when bollinger bands come out from ketler channel)
We use 4 hour charts
I think it works good on EURGBP and USDJPY

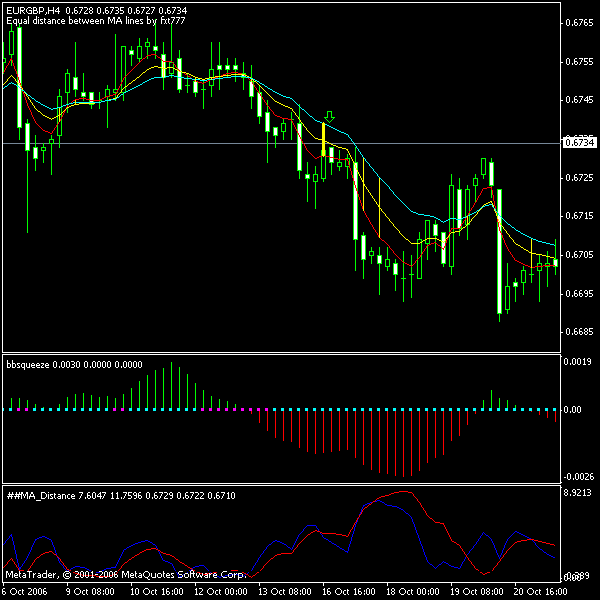
1. When we have a signal the Bollinger bands come out from ketler channel there will appear a blue dot on BB squeeze indicator. This is first signal.

2. But we wait for EMAs to confirm a trend. So when distance between these 3 EMAs are equal this is confirmation of the trend.

3. After we see that distance between these EMAs are equal (there will be yellow line to show this) we wait when price goes to 10 EMA and then retraces and closes on bearish/bullish bar. Important is that price should not close 10 pips (20 pips USDJPY) above of the 10 EMA.

I am still thinking on EXIT point, may be you have better idea?
My idea is exit should be when BB squeeze bars stop to rise.
This is it, if you have question you can ask, When I log in second time I will answer them.

In the meantime see attached charts

thanks
Attached Image
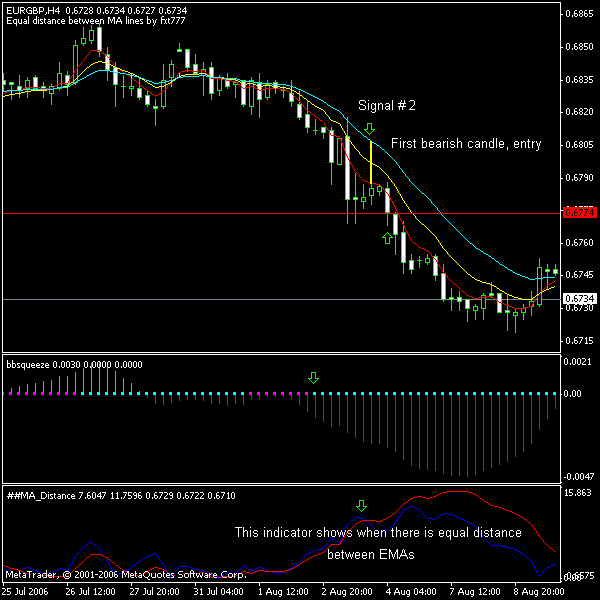
kiss the trend
  • Post #2
  • Quote
  • Feb 16, 2007 12:00pm Feb 16, 2007 12:00pm
  •  fx-trader777
  • Joined Aug 2005 | Status: steady and consistent | 977 Posts
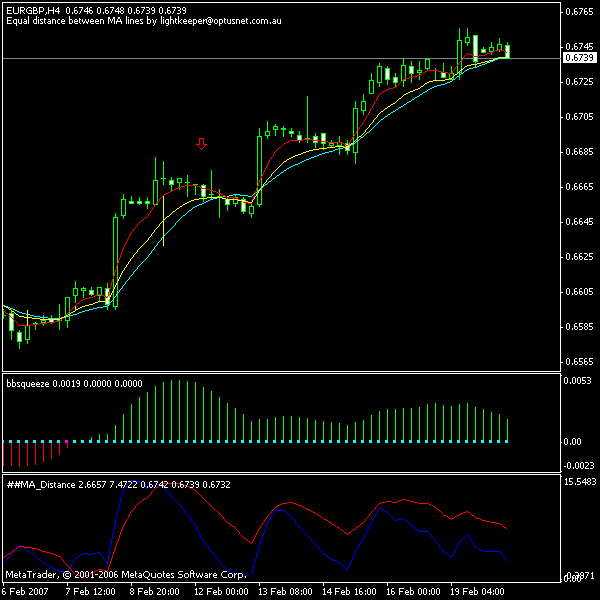
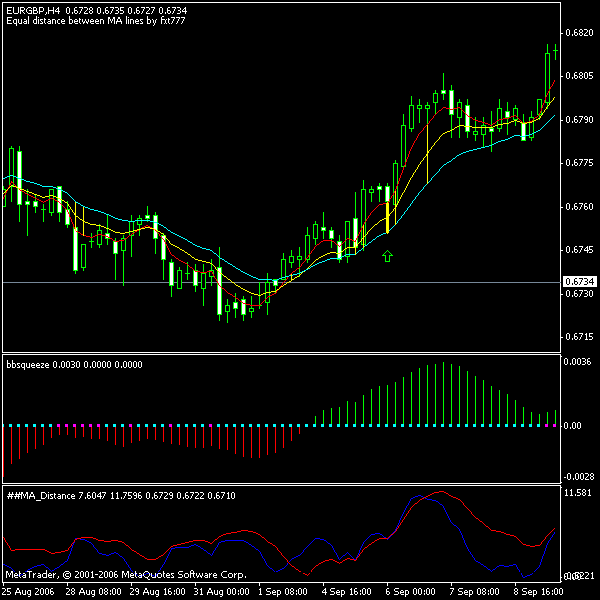
Another one again for EURGBP ..........................

You can trade if there is not a first signal, but not sure how consistent it is
Attached Images
kiss the trend
  • Post #3
  • Quote
  • Feb 16, 2007 12:45pm Feb 16, 2007 12:45pm
  •  fx-trader777
  • Joined Aug 2005 | Status: steady and consistent | 977 Posts
Here is an indicator for EMA distance
Attached File
File Type: zip Desktop.zip   5 KB | 1,087 download
kiss the trend
  • Post #4
  • Quote
  • Feb 16, 2007 6:09pm Feb 16, 2007 6:09pm
  •  zawodowiec
  • | Joined Aug 2006 | Status: Member | 307 Posts
Thanks for posting this method.. looks good so far. Let me get familiar with it and I'll get back to you.
  • Post #5
  • Quote
  • Feb 17, 2007 2:53am Feb 17, 2007 2:53am
  •  fx-trader777
  • Joined Aug 2005 | Status: steady and consistent | 977 Posts
OK no problem,

kiss the trend
  • Post #6
  • Quote
  • Feb 17, 2007 9:21pm Feb 17, 2007 9:21pm
  •  et_phonehome_2
  • | Joined May 2006 | Status: Member | 809 Posts
3. After we see that distance between these EMAs are equal (there will be yellow line to show this) we wait when price goes to 10 EMA and then retraces and closes on bearish/bullish bar. Important is that price should not close 10 pips (20 pips USDJPY) above of the 10 EMA.

If the retracement does not happen to go back to the 10 EMA, does that mean we sit out until it does?
  • Post #7
  • Quote
  • Feb 18, 2007 2:49am Feb 18, 2007 2:49am
  •  nikim
  • | Joined Dec 2006 | Status: Member | 266 Posts
Just wonering if you could post a bb squeeze and as well the input values for each indicator.

thanks
  • Post #8
  • Quote
  • Feb 18, 2007 5:42am Feb 18, 2007 5:42am
  •  fx-trader777
  • Joined Aug 2005 | Status: steady and consistent | 977 Posts
Quoting et_phonehome_2
Disliked
3. After we see that distance between these EMAs are equal (there will be yellow line to show this) we wait when price goes to 10 EMA and then retraces and closes on bearish/bullish bar. Important is that price should not close 10 pips (20 pips USDJPY) above of the 10 EMA.

If the retracement does not happen to go back to the 10 EMA, does that mean we sit out until it does?
Ignored
It happens very seldom, but if it happens we are missing trade

The retracement approach is good, because if you enter immediately after there is # 2 signal then price may retrace near to your stop. So it is better to wait retracement.

thanks
kiss the trend
  • Post #9
  • Quote
  • Feb 19, 2007 5:18am Feb 19, 2007 5:18am
  •  fx-trader777
  • Joined Aug 2005 | Status: steady and consistent | 977 Posts
bb squeeze ............
Attached File
File Type: zip bbsqueeze.zip   5 KB | 884 downloads
kiss the trend
  • Post #10
  • Quote
  • Feb 19, 2007 6:08am Feb 19, 2007 6:08am
  •  Ahil
  • | Joined Sep 2006 | Status: Member | 145 Posts
Could you explain squezze indicator a bit, what is what on it

Thanks
  • Post #11
  • Quote
  • Feb 19, 2007 12:47pm Feb 19, 2007 12:47pm
  •  fx-trader777
  • Joined Aug 2005 | Status: steady and consistent | 977 Posts
Quoting Ahil
Disliked
Could you explain squezze indicator a bit, what is what on it

Thanks
Ignored
BB squeeze is easy explanation of combination of Bollinger bands and Ketler channels.

Unfortunately I do not have Ketler channel in my indicators list, so I can't show you charts as example but I will explain.

If you have in you indicators lists, open 4 hour charts and plot Bollinger bands and Ketler channels. When you see that bollinger bands go inside of ketler channels this is signal that there is not a trend and market is in consolidation period. But when bollinger bands come out from ketler channel this is trend confirmation signal. On BB squeeze this is shown by this way:

1. When you see blue dots after red dots this means that bollinger bands have just come out from ketler channel. And the bars show whether there is momentum or not. When every next bar is larger then previous this means that trend is in force, but when bars stop to rise this is indication that trend has gone (may be temporarily but it realy has gone)

thanks
kiss the trend
  • Post #12
  • Quote
  • Feb 19, 2007 1:25pm Feb 19, 2007 1:25pm
  •  Ahil
  • | Joined Sep 2006 | Status: Member | 145 Posts
Thanks for explanation, a I have seen squeeze before on John Carter webinar

But what if lines goes from red to green or vice versa but bottom dots are not cyan but redish color?

what is the meaning of those underlaying dots (which can be cyan or pink)?


Thanks
  • Post #13
  • Quote
  • Feb 19, 2007 3:03pm Feb 19, 2007 3:03pm
  •  fx-trader777
  • Joined Aug 2005 | Status: steady and consistent | 977 Posts
Quoting Ahil
Disliked
Thanks for explanation, a I have seen squeeze before on John Carter webinar

But what if lines goes from red to green or vice versa but bottom dots are not cyan but redish color?

what is the meaning of those underlaying dots (which can be cyan or pink)?


Thanks
Ignored
LOL what dots?

I do not know what color cyan is LOL

There are two colors: red (or like red) and blue (or like blue)
kiss the trend
  • Post #14
  • Quote
  • Feb 20, 2007 2:48am Feb 20, 2007 2:48am
  •  fx-trader777
  • Joined Aug 2005 | Status: steady and consistent | 977 Posts
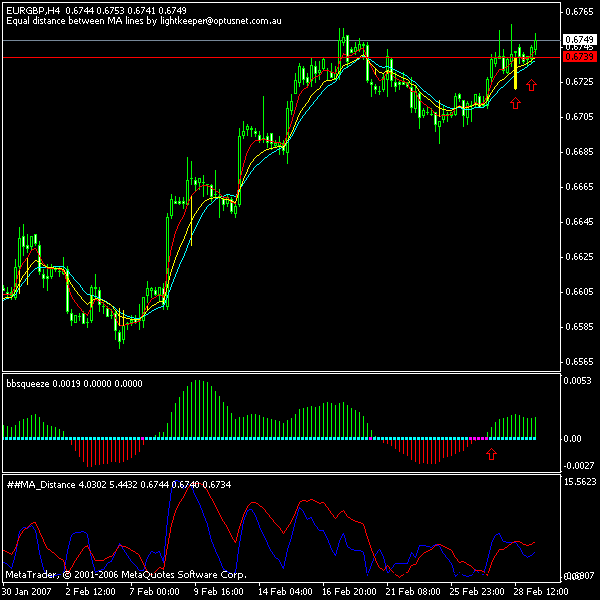
Here is latest example
Price retraced after entry but then went up

thinink to [lace stop at the price were yeello vertical line intersects 10 EMA. But I do not know if it makes any sense
Attached Image
kiss the trend
  • Post #15
  • Quote
  • Mar 1, 2007 4:22am Mar 1, 2007 4:22am
  •  fx-trader777
  • Joined Aug 2005 | Status: steady and consistent | 977 Posts
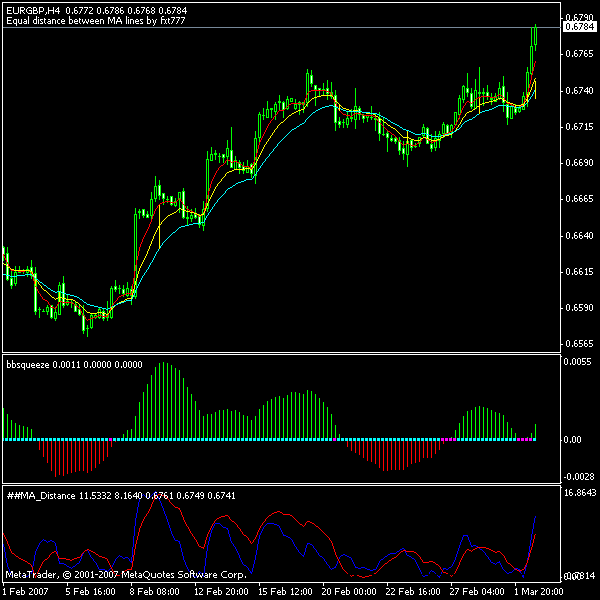
Here is a signal,
Attached Image
kiss the trend
  • Post #16
  • Quote
  • Last Post: Mar 2, 2007 2:27pm Mar 2, 2007 2:27pm
  •  fx-trader777
  • Joined Aug 2005 | Status: steady and consistent | 977 Posts
May be it can be as example where to place stop

price went from entry by more than 20 pips,
Attached Image
kiss the trend
  • Trading Systems
  • /
  • Fxt777 EMA Distance System
  • Reply to Thread
0 traders viewing now
Top of Page
  • Facebook
  • Twitter
About FF
  • Mission
  • Products
  • User Guide
  • Media Kit
  • Blog
  • Contact
FF Products
  • Forums
  • Trades
  • Calendar
  • News
  • Market
  • Brokers
  • Trade Explorer
FF Website
  • Homepage
  • Search
  • Members
  • Report a Bug
Follow FF
  • Facebook
  • Twitter

FF Sister Sites:

  • Metals Mine
  • Energy EXCH
  • Crypto Craft

Forex Factory® is a brand of Fair Economy, Inc.

Terms of Service / ©2021