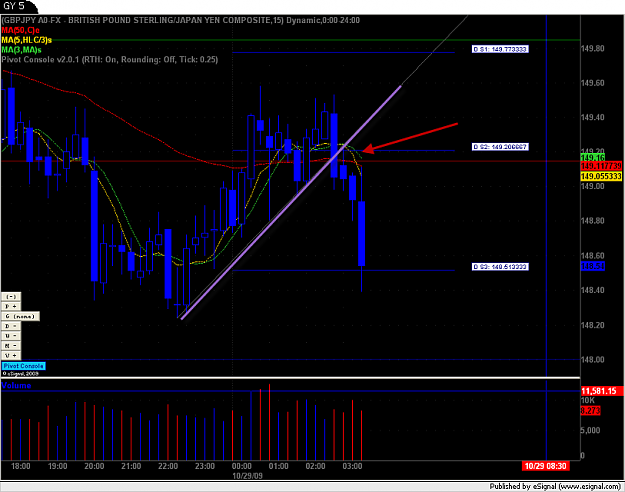
DislikedPK Hold shorts. . .
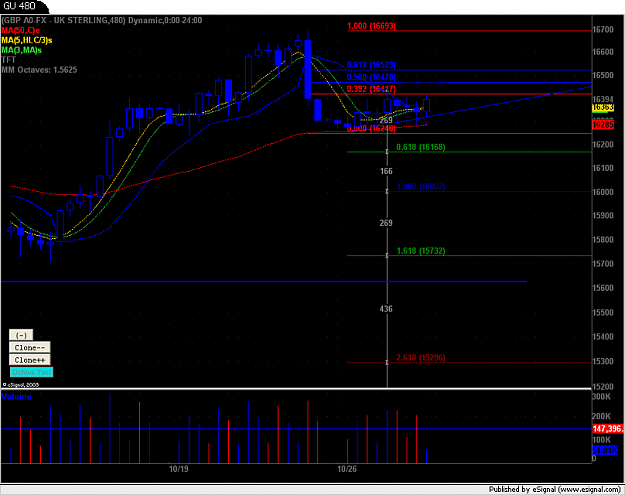
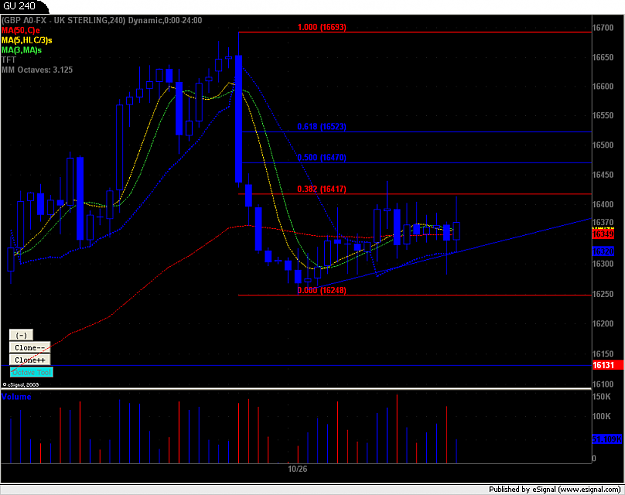
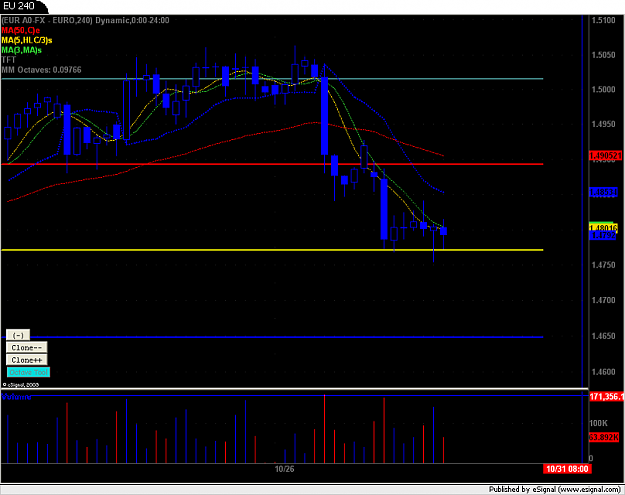
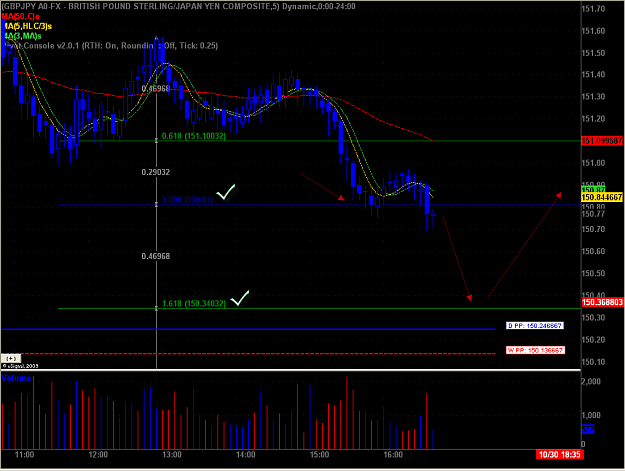
1.4710/33 will be the deciding factor. It was resistance when we dropped to 1.4444 area remember and should serve as support.
If broken then look for price to re-test this area and lower. . .Ignored


- #95
- Edited 1:21pm Oct 30, 2009 10:08am | Edited 1:21pm
- Joined Oct 2007 | Status: Sniper | 14,770 Posts
- #96
- Edited 10:46am Nov 1, 2009 10:30am | Edited 10:46am
- Joined Oct 2007 | Status: Sniper | 14,770 Posts