DISCLAIMER. MUST READ!
ONLY DEMO THIS SYSTEM WHICH IS POSTED HERE FOR DEVELOPMENT PURPOSES ONLY. IF YOU TRADE THIS SYSTEM LIVE, ALL RISKS ARE YOUR OWN RESPONSIBILITY AND YOU UNDERSTAND THIS BEFORE DOWNLOADING AND IMPLEMENTING ANY AND ALL INDICATORS & TEMPLATES.
Right, now we have got that out of the way.
I am currently testing this system which I have been working on variations of for the last month. This is the final system which has only been tested on demo and this testing started this morning with the Tokyo open.
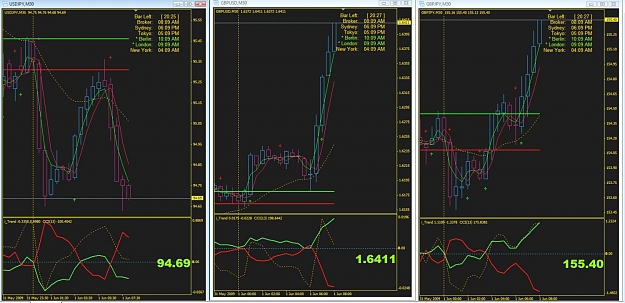
The T130B stands for the "Tokyo 1st 30min bar" works well on USD/JPY GBP/JPY but should hold up on most pairs and time frames above M30.
All templates and indicators are in this First post and will be updated to this post to prevent confusion.
Hopefully, the more people testing this system will improve it. However, it is pretty much complete and I would like to keep indicators to a bare minimum with no more than are already on the charts.
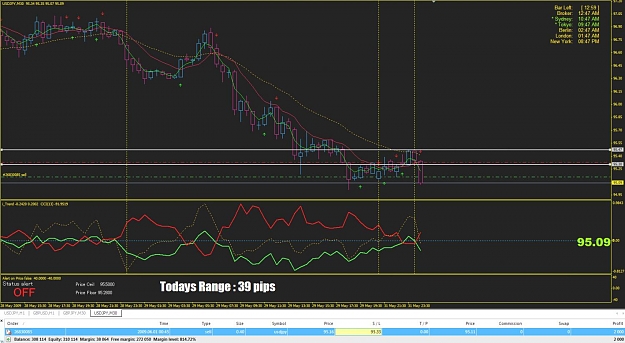
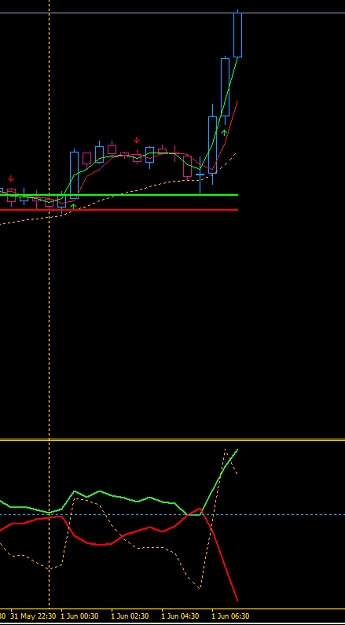
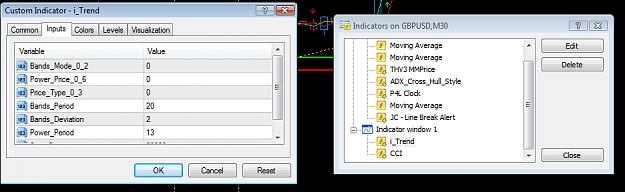
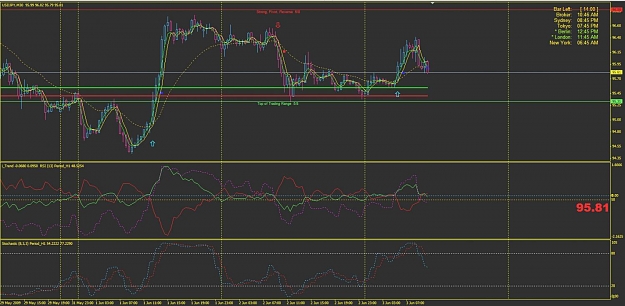
Indicators: EMA 22 close, EMA 4 close, EMA 3 open, Sidus RSI crossing, CCI 13 , I-trend, P4 Clock, M1 price alert.
Entry Short.
Switch the chart to a H1, H4, & D1 TF to look at the direction of the Orange 22 EMA and make sure the trend on these TF's are Short, we want to only trade any given pair in the direction of these TF's as we want to catch the major moves and not the retracements.
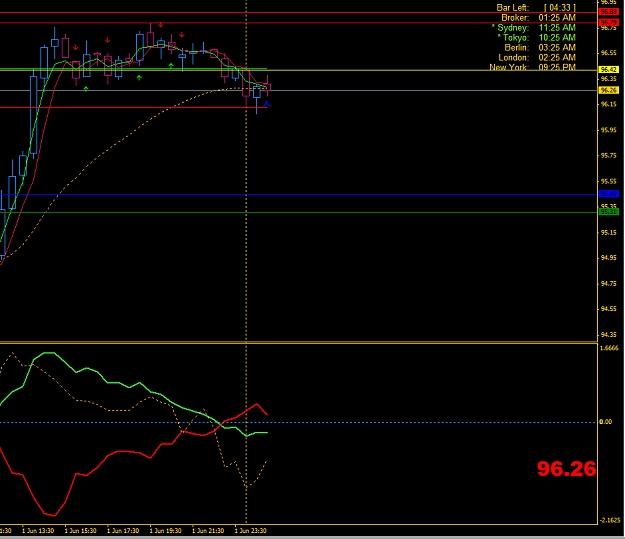
We wait for the Tokyo open at 00:00 and place a line on the High & Low and set the Price alert in the bottom window to alert us when price breaks the ceiling or the floor. We do not trade the price break, ONLY the Green 4EMA crossing the High or Low.
SL is 5 pips above low or high.
We must get a SIDUS EMA RSI CCI laert arrow in the direction of the trade and the 4 EMA must break the low with the I-trend indicators showing a trend in the direction of the trade, for short the RED lines must be Above the Green and spreading out, RSI must be below 50 line or about to break it and moving down. Exit is when either the I-Trend indicator flattens out or the H1 stochistic tells us the trade is moving into the over sold area and the H1 RSI is starting to lose steam.
LONG trades are the reverse or the above.
Give her a run around the block and let me know if you have any suggestions.
--------------------------------------------------------------------------
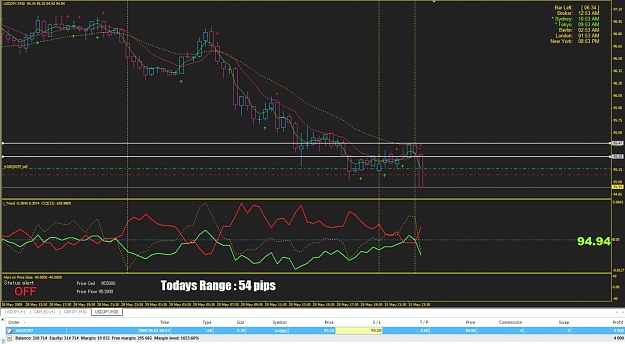
Changed ADX indi for SIDUS EMA RSI CCI alert and added a multi time frame Stochastic and MTF RSI which we use on the M30 on the M30 chart. These give us a good idea of the exit.
ONLY DEMO THIS SYSTEM WHICH IS POSTED HERE FOR DEVELOPMENT PURPOSES ONLY. IF YOU TRADE THIS SYSTEM LIVE, ALL RISKS ARE YOUR OWN RESPONSIBILITY AND YOU UNDERSTAND THIS BEFORE DOWNLOADING AND IMPLEMENTING ANY AND ALL INDICATORS & TEMPLATES.
Right, now we have got that out of the way.
I am currently testing this system which I have been working on variations of for the last month. This is the final system which has only been tested on demo and this testing started this morning with the Tokyo open.
The T130B stands for the "Tokyo 1st 30min bar" works well on USD/JPY GBP/JPY but should hold up on most pairs and time frames above M30.
All templates and indicators are in this First post and will be updated to this post to prevent confusion.
Hopefully, the more people testing this system will improve it. However, it is pretty much complete and I would like to keep indicators to a bare minimum with no more than are already on the charts.
Indicators: EMA 22 close, EMA 4 close, EMA 3 open, Sidus RSI crossing, CCI 13 , I-trend, P4 Clock, M1 price alert.
Entry Short.
Switch the chart to a H1, H4, & D1 TF to look at the direction of the Orange 22 EMA and make sure the trend on these TF's are Short, we want to only trade any given pair in the direction of these TF's as we want to catch the major moves and not the retracements.
We wait for the Tokyo open at 00:00 and place a line on the High & Low and set the Price alert in the bottom window to alert us when price breaks the ceiling or the floor. We do not trade the price break, ONLY the Green 4EMA crossing the High or Low.
SL is 5 pips above low or high.
We must get a SIDUS EMA RSI CCI laert arrow in the direction of the trade and the 4 EMA must break the low with the I-trend indicators showing a trend in the direction of the trade, for short the RED lines must be Above the Green and spreading out, RSI must be below 50 line or about to break it and moving down. Exit is when either the I-Trend indicator flattens out or the H1 stochistic tells us the trade is moving into the over sold area and the H1 RSI is starting to lose steam.
LONG trades are the reverse or the above.
Give her a run around the block and let me know if you have any suggestions.
--------------------------------------------------------------------------
Changed ADX indi for SIDUS EMA RSI CCI alert and added a multi time frame Stochastic and MTF RSI which we use on the M30 on the M30 chart. These give us a good idea of the exit.
Attached Image (click to enlarge)
Attached File(s)
Starting to see instead of just looking.