• Home
  • Forums
  • Trades
  • News
  • Calendar
  • Market
  • Brokers
  • Login
  • Join
  • User/Email: Password:
  • 2:05am
Menu
  • Forums
  • Trades
  • News
  • Calendar
  • Market
  • Brokers
  • Login
  • Join
  • 2:05am
Sister Sites
  • Metals Mine
  • Energy EXCH
  • Crypto Craft

Options

Bookmark Thread

First Page First Unread Last Page Last Post

Print Thread

Similar Threads

I Need A talented Programmer For EA 0 replies

Project for Coder/Programmer 2 replies

Project for Coder/Programmer 22 replies

Project for gifted Coder/Programmer 18 replies

Need to code alert with MAs and Laguerre ... looking for a coder/programmer 0 replies

  • Platform Tech
  • /
  • Reply to Thread
  • Subscribe
  • 8
Attachments: Project for talented coder/programmer
Exit Attachments
Tags: Project for talented coder/programmer
Cancel

Project for talented coder/programmer

  • Post #1
  • Quote
  • First Post: May 24, 2009 5:37am May 24, 2009 5:37am
  •  CindyXXXX
  • Joined Feb 2008 | Status: Member | 6,736 Posts
Hello All

Just wondering if anyone knows of or wants to program a simple Trendline indicator.

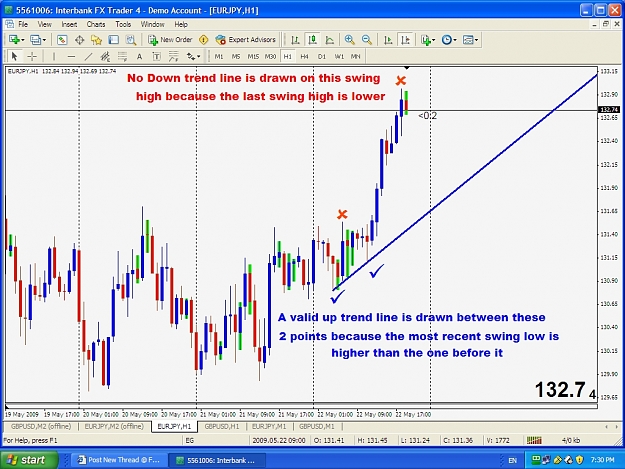
Basically it just draws a trendline from the last 2 (from right to left) swing high/low points.

Swing high meaning a candle with a higher high by at least 1 pip to the candle to the left of it and the candle to the right after it has closed.

And vice versa for a swing low...

So a vaild downtrend line will be drawn when the most recent swing high is lower than the previous swing high

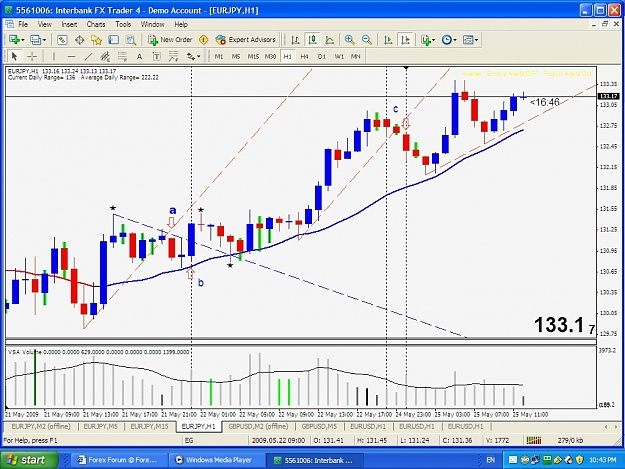
And a valid an uptrend line will be drawn when the most recent swing low is higher than the previous swing low. (As shown in picture by blue ticks)

If the last 2 swing points are not in a trending motion for example for an down trend line the most recent swing high is higher than the swing high before it then it is not valid and therefore no line is drawn. (As shown in the picture by red crosses)

Would also be handy if it had the options of :

1) An Alert (set to a chosen pip distance) and the ability to switch it on or off
2) Number of days in history to show/ Or show no history (show only current line, and only disapear once a new valid line is created.)

I would be so greatful if someone could create this indi - If someone wants I can also show then how I use it.

Thanks guys
Attached Image (click to enlarge)
Click to Enlarge

Name: TL indi.jpg
Size: 313 KB
Time hides Nothing
  • Post #2
  • Quote
  • Edited 12:20pm May 24, 2009 12:04pm | Edited 12:20pm
  •  Zen_Leow
  • Joined Jun 2008 | Status: Programming for a better future. | 649 Posts
here's the most basic version that plots the latest trendline only.

I modified a swing bar indicator I created previously in order to make this... so this also plots out all the up and down swings as up and down arrows. might be a useful bi-product.

regards,
Zen
Attached File(s)
File Type: mq4 Trendline_Plotter.mq4   6 KB | 312 downloads
Programming for a better future.
 
 
  • Post #3
  • Quote
  • Edited 3:42pm May 24, 2009 3:29pm | Edited 3:42pm
  •  CindyXXXX
  • Joined Feb 2008 | Status: Member | 6,736 Posts
Quoting Zen_Leow
Disliked
here's the most basic version that plots the latest trendline only.

I modified a swing bar indicator I created previously in order to make this... so this also plots out all the up and down swings as up and down arrows. might be a useful bi-product.

regards,
Zen
Ignored
Fantastic as always thanks Zen

Just one thing though- it maps the swing points out perfectly but it only draws one line at a time so if there is a down trend line and an uptrend line it will only show one of them (the most recent) So it would never draw a flag for example.

Also an option to turn off the arrows would be good cause if I change the colour to my chart background after I switch back and forth a time frame it changes itself back to the default colour.

If anyone wants to fix this and also add an Alert feel free!

Zen Leow You must be one of the most helpful people on this forum you deserve a medal

Thanks again
Time hides Nothing
 
 
  • Post #4
  • Quote
  • May 25, 2009 7:35am May 25, 2009 7:35am
  •  Zen_Leow
  • Joined Jun 2008 | Status: Programming for a better future. | 649 Posts
oh I see. I initially thought it was supposed to be a new up trend line negates the previous down trend line and vice versa. Thus I deliberately coded it to be so.

all it takes is comment away 2 if statements and you get your flag. Here's version 2

Would appreciate if you could explain how you'd use this though. I sometimes just blindly code stuffs for others not knowing what I can gain from them... haha

regards,
Zen
Attached File(s)
File Type: mq4 Trendline_Plotter_v2.mq4   6 KB | 424 downloads
Programming for a better future.
 
 
  • Post #5
  • Quote
  • May 25, 2009 7:51am May 25, 2009 7:51am
  •  CindyXXXX
  • Joined Feb 2008 | Status: Member | 6,736 Posts
Quoting Zen_Leow
Disliked
oh I see. I initially thought it was supposed to be a new up trend line negates the previous down trend line and vice versa. Thus I deliberately coded it to be so.

all it takes is comment away 2 if statements and you get your flag. Here's version 2

Would appreciate if you could explain how you'd use this though. I sometimes just blindly code stuffs for others not knowing what I can gain from them... haha

regards,
Zen
Ignored
Haha no problem at all Zen - I will prepare a PM

Thanks so Much
Time hides Nothing
 
 
  • Post #6
  • Quote
  • Edited 9:15am May 25, 2009 9:03am | Edited 9:15am
  •  CindyXXXX
  • Joined Feb 2008 | Status: Member | 6,736 Posts
Ok I couldn't send any pics by PM so I will post them here.

There first chart shows the simple break out method using the H1 time frame or higher... I just grabbed the most recent potential trades and took a pic (not the most earth shattering examples but I didn't want to cherry pick).

a) the up trend (red) line is broken and the previous candle before the break was an up close so trade is entered immediately on the break.

b) THe down trend (blue) line is broken but the last bar was an up close so no trade on the break of the line. It then opened above the line but quite a way away from the trend line so no trade there either.

c) this one happened today - The up trend line was boken but the previos candle was a down close so no trade there. But them it opens out side the line and right near it so the trade is entered on the open of that candle.

As for SL and TP this can be played with you could drop down to a smaller TF and Use the most recent S/R level for a SL - or even just put the stop loss behind the TL... And you could trail the profit using the method I personally use on the 2m chart which I will show below but this is up to you.
Attached Image (click to enlarge)
Click to Enlarge

Name: Zen.jpg
Size: 310 KB
Time hides Nothing
 
 
  • Post #7
  • Quote
  • May 25, 2009 9:14am May 25, 2009 9:14am
  •  CindyXXXX
  • Joined Feb 2008 | Status: Member | 6,736 Posts
This is slightly more complex but still quite simple... I copied this example from my personal trading rules document.

The first chart shows the trend line that was drawn on the H1 chart...

Notice that the breakout conditions from the previous technique aren't a factor here (two seperate methods) although it can add some more confidence the 2m trade obviously.

Once the Trend line is broken along with accompanying PA e.g. HH and or HL for an upward move.

Looking for volume on the up move and then declining volume on the 3-5 bar pull back – Looking for a weak pull back (small candles) with the pull back remaining above the TL

Entry (Large Red Arrow) is on an CEC (bull eats bear) from either the 2m or 5m TF

SL is placed 4 pips above the nearest S/R Swing High or Swing Low (Red Line) and trailed (Orange Lines) behind each Full Bodied (minimum wicks on either side) Bullish candle that makes higher ground.

A new lot (Small Red Arrows) is entered on each valid 3- 5 bar pull back on declining volume until the existence of Divergence .

Exit is when the market stops the trade out (red X). If there is Divergence, Strong S/R or an obvious weak market – trade can be exited manually at own discretion.

So thats about it in a nutshell - if you want to look at more explanations or examples of this 2m method along with all the indicators etc. Then that website I told you about will have all you will need.

But as I said the Simple H1 method works pretty dam good as well.

Thanks Zen
Attached Image(s) (click to enlarge)
Click to Enlarge

Name: Zen B.jpg
Size: 227 KB
Click to Enlarge

Name: Zen C.jpg
Size: 341 KB
Time hides Nothing
 
 
  • Post #8
  • Quote
  • May 26, 2009 6:42am May 26, 2009 6:42am
  •  Zen_Leow
  • Joined Jun 2008 | Status: Programming for a better future. | 649 Posts
Thanks, I'll try and digest what you've described.
Programming for a better future.
 
 
  • Post #9
  • Quote
  • Last Post: May 15, 2010 10:50pm May 15, 2010 10:50pm
  •  Brightredmeg
  • | Joined Sep 2009 | Status: Member | 7 Posts
Following on from this thread, I am wondering how difficult it would be to take that indictor (flexi_bar swing) & convert it to an actual swing chart, as in the attached diagram?

The swing chart is programmed into Market-Analyst, but it would be easier to trade it through MT4. There would need to be some slight modifications as to how outside bars are handled (when compared to the way flexi_bar programme uses it).

I can discuss the proposed system via email (brightredmegaphoneat g maildot com) if you wish.

Thanks
Attached Image (click to enlarge)
Click to Enlarge

Name: WTF.jpg
Size: 164 KB
Attached File(s)
File Type: mq4 Flexi_bars_swing_v2.mq4   6 KB | 249 downloads
 
 
  • Platform Tech
  • /
  • Project for talented coder/programmer
  • Reply to Thread
0 traders viewing now
Top of Page
  • Facebook
  • Twitter
About FF
  • Mission
  • Products
  • User Guide
  • Media Kit
  • Blog
  • Contact
FF Products
  • Forums
  • Trades
  • Calendar
  • News
  • Market
  • Brokers
  • Trade Explorer
FF Website
  • Homepage
  • Search
  • Members
  • Report a Bug
Follow FF
  • Facebook
  • Twitter

FF Sister Sites:

  • Metals Mine
  • Energy EXCH
  • Crypto Craft

Forex Factory® is a brand of Fair Economy, Inc.

Terms of Service / ©2023