I Would like an overbought/oversold indicator for individual candles.
As follows:
(5SMA_value+8LWMA_value+10LWMA_value+12LWMA_value+15LWMA_value)/5=average_of_mas
if price is above 15LWMA
take the difference of the High of the candle and the average of MAs.
high_of_candle - average_of_mas=overbought_oversold_value
if price is below 15LWMA
take the difference of the Low of the candle and the average of MAs.
low_of_candle - average_of_mas=overbought_oversold_value
I would like the indicator to draw bars in its own window.
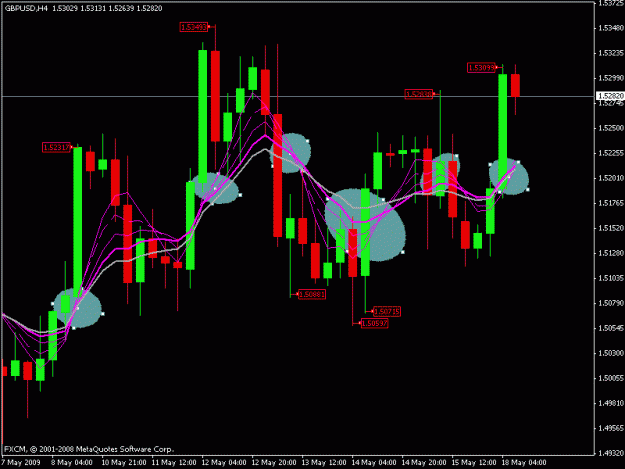
The basic premise of the indicator is to show instantaneous overbought and oversold conditions in the market based on a field of Moving Averages. When the current price travels too far outside that field of MAs an overbought/oversold state is attained wherein price needs to return to that field of MAs before moving on to the next overbought/oversold state.
I know nothing about coding and would appreciate any help I could get.
Thanks!
Skracor247
As follows:
(5SMA_value+8LWMA_value+10LWMA_value+12LWMA_value+15LWMA_value)/5=average_of_mas
if price is above 15LWMA
take the difference of the High of the candle and the average of MAs.
high_of_candle - average_of_mas=overbought_oversold_value
if price is below 15LWMA
take the difference of the Low of the candle and the average of MAs.
low_of_candle - average_of_mas=overbought_oversold_value
I would like the indicator to draw bars in its own window.
The basic premise of the indicator is to show instantaneous overbought and oversold conditions in the market based on a field of Moving Averages. When the current price travels too far outside that field of MAs an overbought/oversold state is attained wherein price needs to return to that field of MAs before moving on to the next overbought/oversold state.
I know nothing about coding and would appreciate any help I could get.
Thanks!
Skracor247