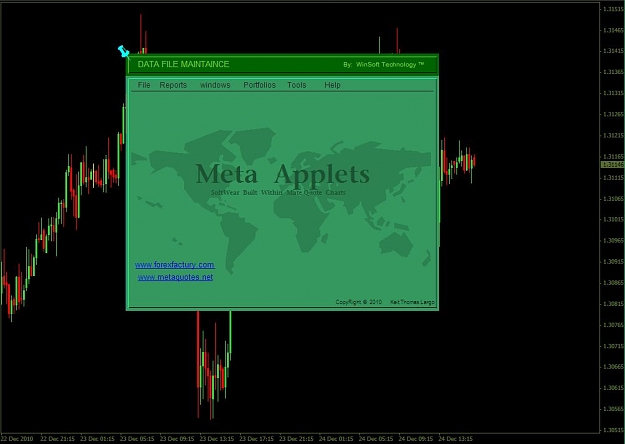
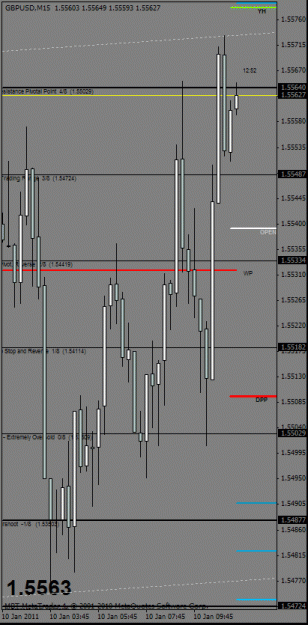
e.g. How do you draw a solid blue rectangle on top of the chart covering the candles?
I'm trying to create a table of sorts with a lot of data.
I've seen it done in another indicator but just can't seem to mimic the effect myself. if the object's background is set to false, the object although comes to the foreground but it becomes just the outline, if background set to true, it becomes solid but goes to the background. I need it to be solid but in the foreground.
Any ideas? Thanks
regards,
Zen
Programming for a better future.


