Dear coders, pls help me modify this indicator default mode as "inactive" when you put it onto the chart. It should only be "activated" when I press the button. Also, if the mode is "inactive", it should also stay "inactive" when I change to a different time frame. Thank you. Pls sent back mq4 file, not ex4 file. This is the only way I can learn from your programming skill. Thank you very much for your precious time.{file}
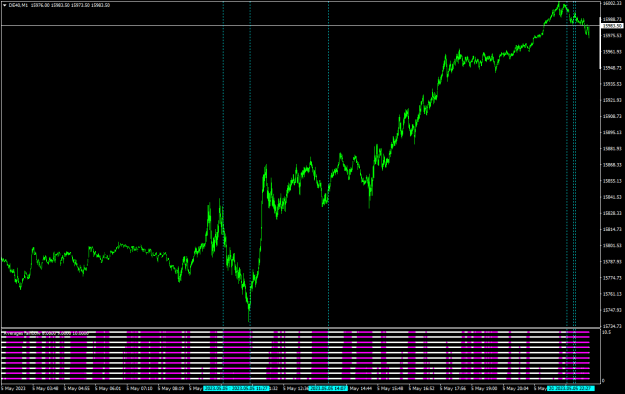
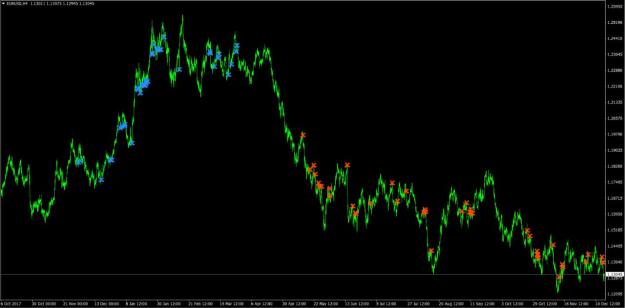
{quote} Hi ffss Do you think this fit on (Germany 40 index) - {image}
Ignored
Not sure, i mean this kind of currency strength. I guess there is nothing to compare to with indices as for currencies is one currency vs other but with indices not? I dont know.
Hi dear programmer. I have a pending order EA whose function is to press the spacebar to hang linit orders in percentages:
I want to add the Stop order feature. When I press {Ctrl}, I can hang the Stop order: Trouble modifying the source code.... ️
{quote} One thing you can do is to set the fixed min/max values in both macd settings to the same values. The single line macd in mt4, has the histogram as the distance between the 2 ema's, so setting min/max window values would be based on an estimation of these values, so that most of the time the entire macd is within the window. Pic has 2 macds, 1 default settings, the other default*10, but same fixed min/max values of 50pt, so their zero lines are the same location. {image}
Ignored
Thanks for the suggestion. I have tried this and it sort of works but you often have to readjust your min max levels to stop the charts from getting cut off.
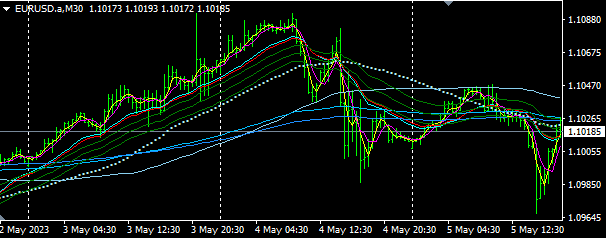
{quote} Aside from the previous post of setting fixed-min/max values the same, you could alternatively use this too. Macd_2x_window - 2 regular macd's in the same subwindow - separate mtf's {image} {image} {file}
Ignored
Part of the 'signal' is showing the change in separation between the pairs macd curves. With two windows this gets lost. Thanks for the suggestion.
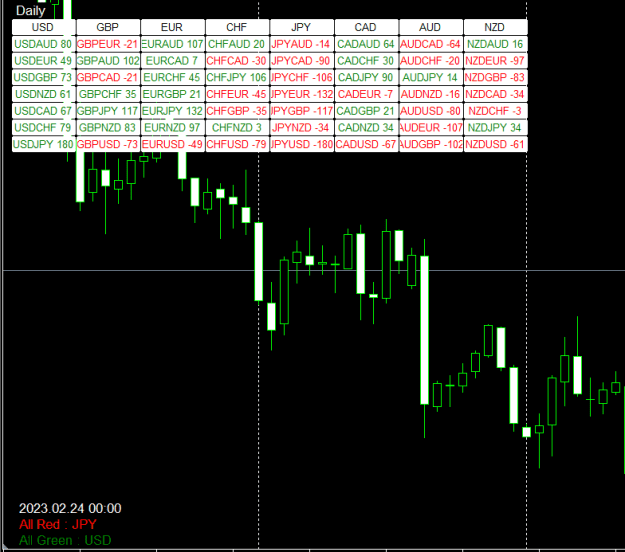
Please Great People. can i get this indicator or close to it, that will tell when a particular currency is going on the particular direction of total strong or total weak in relation to other currencies. I will really appreciate. thanks
Break of Structure Indicator This dynamic structure indicator maps potential support and resistance zones (in all markets)When the Order block is touched by the price with an alert, detect Break of Structure, mark Order Block and draw Entry / Stop and Risk to Reward lines. By clicking a button on the chart, the trend can be set to filter signals in a direction. Entry / Stop and Risk to Reward lines can also be toggled on / off. {file} {image}
Ignored
Hi Nod32,
you posted this indicator but it is not working, can you provide a working indicator for "break of structure" please...
or anybody has a similar indicator ?