Disliked{quote} Wow! you are a good person! So kind of you. I almost hate to ask. If you have time: All bars would be the same size, like a histogram similar to the pic in post 57,433. Where the value is below the "level" the corresponding bar would be red for below level, green for above. No interpretation of size, trend, or anything. Just greater than or less than. A quick glance for "trade/no trade" decision. No level line needed. BWI is a great indicator that gets right to the chase of the best value Bollinger bands have to offer, IMO. It's the best...Ignored
But you must understand that the BWI is a dynamic indicator, so the values change, and your 20 level might be good for some time, but when market conditions change, it will not be representative to this change.
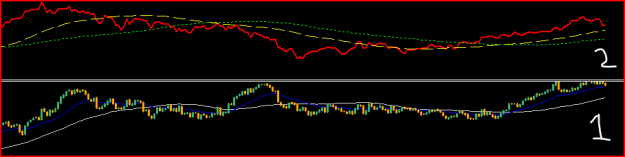
Attached File(s)
If you're looking for the Holy Grail indicator - STOP!
1