Anyone code it to indicator.
ı can explain but my english not enough for that .
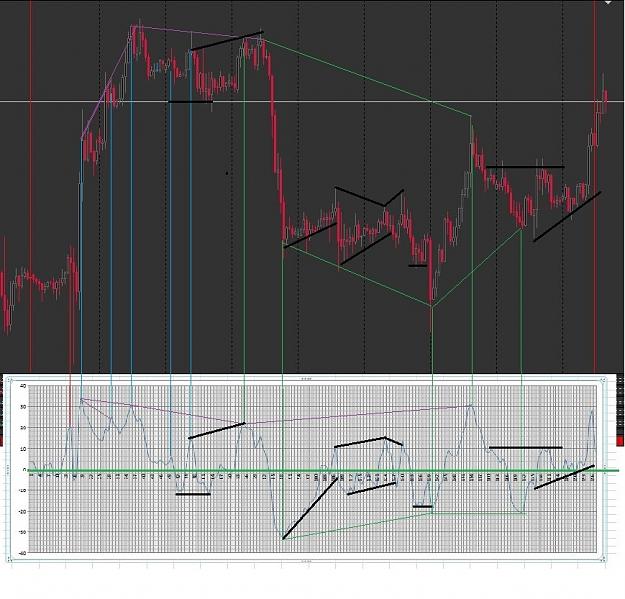
Think like that Rsı based overbuy or oversell indicator.
Rsı must move from mid line (50) to 70 for overbuy or 30 for oversell => 20 point from mid line.
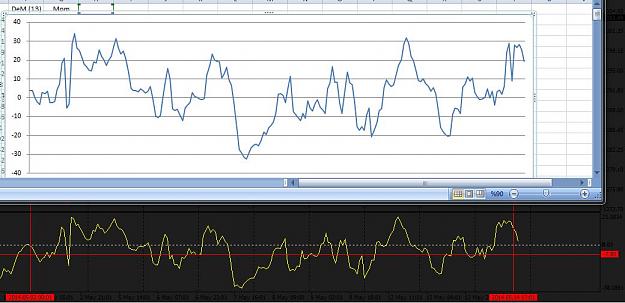
But in ccı 100 point ; stoch 30 point ; Mfı 30 point ; Dem (0,2 x 100) = 20 point
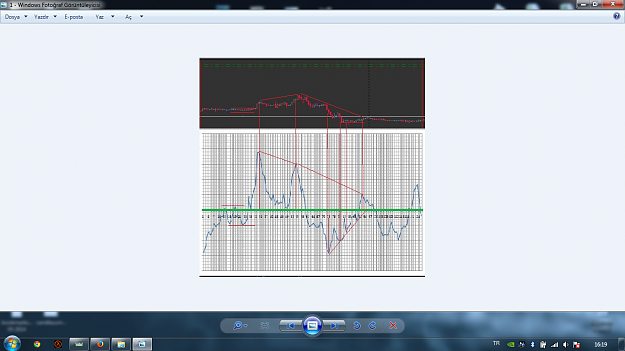
ı try to collect (Rsi,Stoch,Cci,Mfi,Dem) all overbuy/sell point in one indicator and their divergence.
I hope you can understant
Example picture (Natural Gas (2014.05.13 00:01) to (2014.05.14 08:16) 15 min Chart
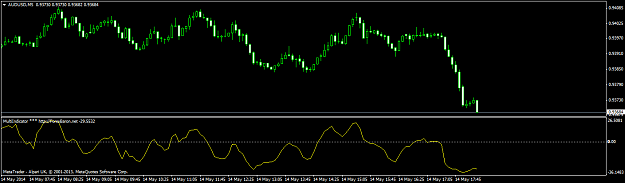
Gold (2014.05.02 00:01) to (2014.05.14 12:01)
Disliked{quote} if you do not describe what you want nobody will do it. or ask at mql5.com/en/jobIgnored
Think like that Rsı based overbuy or oversell indicator.
Rsı must move from mid line (50) to 70 for overbuy or 30 for oversell => 20 point from mid line.
But in ccı 100 point ; stoch 30 point ; Mfı 30 point ; Dem (0,2 x 100) = 20 point
ı try to collect (Rsi,Stoch,Cci,Mfi,Dem) all overbuy/sell point in one indicator and their divergence.
I hope you can understant
Example picture (Natural Gas (2014.05.13 00:01) to (2014.05.14 08:16) 15 min Chart
Attached Image (click to enlarge)
Gold (2014.05.02 00:01) to (2014.05.14 12:01)
Attached Image (click to enlarge)