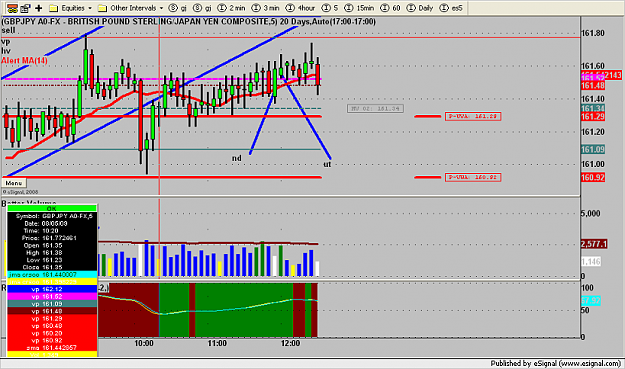
Here's a trade i took yesterday on gbp$ (buy/long).
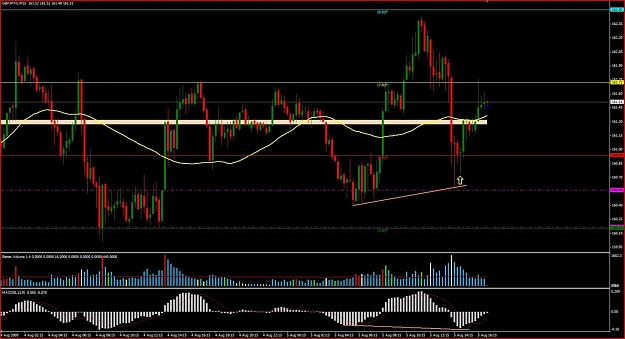
my M5 buy/long gbp$ trade was indicated by the two yellow horizontal thick lines.
(just to clarify... this were my approximate, not exact, entry & exit).
Dodger blue line on price chart is GannHiLo. then there's Bollinger bands. Better Volume 1.4 & other basic indicators.
I am not well-versed yet, but here's what i saw.
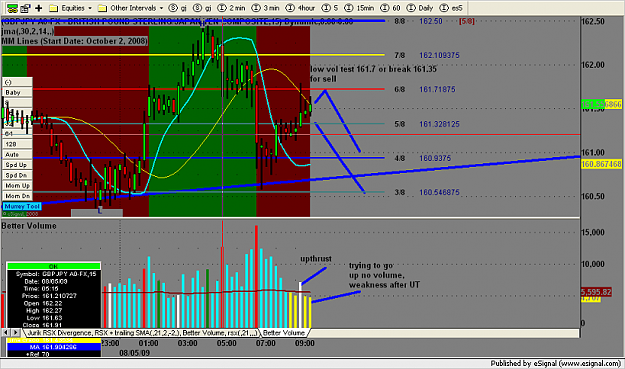
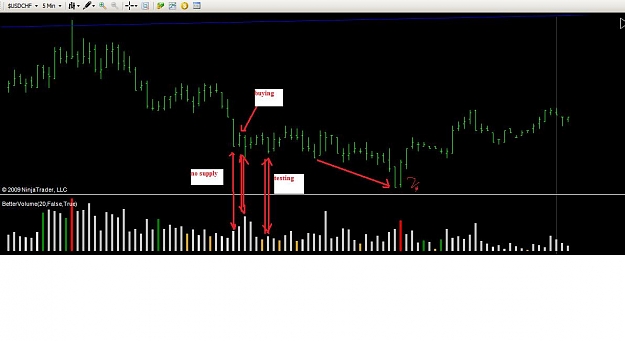
Low vol. test (lime green) [ + CCI30 bull.divergence] , i entered shortly after. (low volume yellow bar ,after the high churn lime green bar, in BetterVol.1.4 indicator correspond to a NO Supply bearish candle) my exit (chocolate vertical line) was on the bar/candle which was a low spread high churn bar (after a climax high, wide spread bar).
ADX14 & CCI30 also have "topped".
my M5 buy/long gbp$ trade was indicated by the two yellow horizontal thick lines.
(just to clarify... this were my approximate, not exact, entry & exit).
Dodger blue line on price chart is GannHiLo. then there's Bollinger bands. Better Volume 1.4 & other basic indicators.
I am not well-versed yet, but here's what i saw.
Low vol. test (lime green) [ + CCI30 bull.divergence] , i entered shortly after. (low volume yellow bar ,after the high churn lime green bar, in BetterVol.1.4 indicator correspond to a NO Supply bearish candle) my exit (chocolate vertical line) was on the bar/candle which was a low spread high churn bar (after a climax high, wide spread bar).
ADX14 & CCI30 also have "topped".
Attached Image (click to enlarge)