1st of all I want to thank billbss for bring this method on a different thread. Although we determined that the original method was curve fit, I really liked the concept and tried using my own versions of momentum to make trades with. Another words, I only made trades in the direction as I define momentum. Whether this is any better than the original method cannot be back tested, but on forward testing it has be very good. And, even on recent days when the original method was terrible, this filtered version performed extrememly well.
I am now testing 4 different strategies for entering the market. Some of these strategies give us overlapping trades, but many times they are completely different. My thoughts at the moment are to actually trade all 4 strategies simultaneous becuase as i have seen, some work well at times and others work better at times and yet others sometimes don't work at times. The idea is that if 1 entry isn't working, the others will pick up the slack. I am still testing this and will continue to record the trades nightly.
Basics of the System-
- Trade from 06:00 GMT to 19:59:59 GMT except on Fridays when you should end trading at 17:59:59 GMT
- I am testing both the H1 and M30 TF's for all 5 pairs listed.
- Do not trade the London session during a London Bank Holiday and do not trade the US session during a US bank holiday.
- Use these initial Stop Loss settings
- EurUsd - 35 pips
- EurJpy - 45 pips
- GbpJpy - 55 pips
- GbpUsd - 45 pips
- UsdJpy - 25 pips
- Keep the trade open until any bar closes at break even or you are in profit or your stop loss has been hit
- After the close of the bar when you opened your position, if you are not in profit and in a long trade, move the s/l to 1 pip below the low of the bar you opened your position on and vice versa for a short trade
- Here is an indicator that you can put on your chart. When the bar goes to blue you enter long and when it goes to orange-red you enter short, but only in the direction of your filter. As long as you leave your chart open, the bars will not re-paint. When you close your chart however and re-open it, they will revert to knowledge that is known, so backtesting this system using this indicator is futile. Attached File(s)
Long entry-
- Current Bar goes below the Low of previous bar. Then, comes back above the Close of the previous bar.
- Enter 1pip + spread above the Close of previous bar.
Short entry-
- Bar goes above the High of previous bar. Then, falls back below the Close of the previous bar.
- Enter 1pip below the Close of previous bar.
Okay....now we need to filter our trades so we are only taking trades in direction of momentum. There are 4 different filters that I am testing, each one independent of the other. the first filter is described on this 1st post below. The additional 3 filters i will post a link to when I get them on a spereate post. Once again, I think it would be best to use all 4 systems to make trades, but only testing will tell.
Filtering the Trade:
- MACD Filter - Listed below in this post
- Here is the indicator for this filter only. When a blue line is on your chart, look for long trades only, and when a red line is on your charts, look for short trades only. You can change the MACD settings and also the number of back lines to be left on your screen. As of right now, default settings are what I am using.
- Attached File(s)
- How this filter is applied is listed below in this post
- Advanced MACD Filter
- ZZI Filter - See post #115 Here
- Stochastic Filter - See post #114 Here
This filter uses MACD in a momentum type of way to determine trade direction and it has been working pretty good. Is there a better way? Maybe, but for now this is what I have been using. MACD settings should be set to 12,26,9
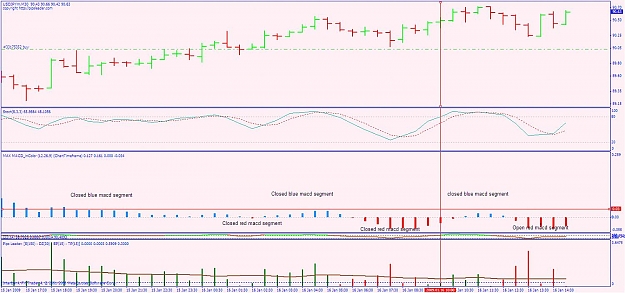
You will see that the filter is colored. MACD is blue when it is above 0 and red when it is below 0. Very simple right? Okay...here is where it gets tricky.....Each time the MACD goes red and then goes to blue, I call this a Closed Red Segment. Every time the MACD goes blue and then goes red I call this a Closed Blue Segment. Hopefully this is all clear.
Okay, so now you are seeing Closed Red Segments and Closed Blue Segments on the MACD. Now it is time to use those close segments to determine the direction of the trade. Each Closed segment is it's own entity and to determine trade direction you will be comparing a current Open Red Segment (one that is still red) to the last Closed Red Segment or the current Open Blue Segment to the last Closed Blue Segment.....here is a picture that explains the segments. The MACD indicator is the 2nd indicator down and is explained by text on the chart.
Okay, you are always comparing any open red segment to the previous closed red segment and any open blue segment to the previous closed blue segment.....now comes the next part....using these segments to determine trade direction.....
First thing you will do when you open a chart and put the MACD on is is to determine current trade direction. You do that by determining the last known breakout point using the macd by comparing blue segments to blue segments and red segments to red segments. Determination of your 1st trade direction after opening your chart you will use both closed segments and the open segment. Once trade direction is determined you will then only compare open red vs closed red and open blue vs closed blue....let me explain in a picture....
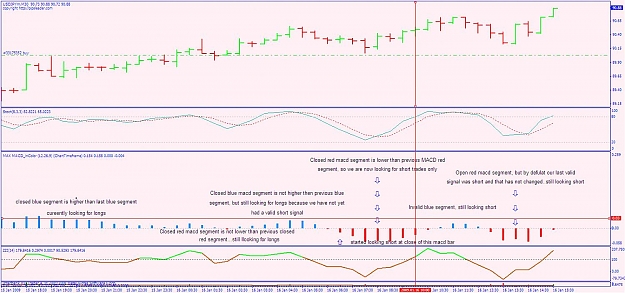
so...when you put on the MACD on your chart for the 1st time, you would conclude that at the moment we are only looking for short trades.
Another example of this with explanation can be found Here on post 231
Okay...now that we have determined our initial trade direction, all we need to do is maintain this direction. Please remember that now that we have determined initial trade direction we will always be only comparing an open red segment with the previous closed red segment and an open blue segment with the previous closed blue segment.
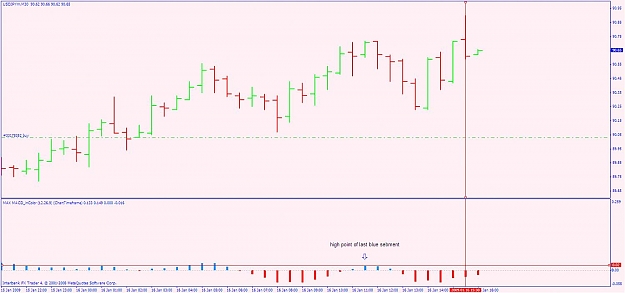
So I will now post another chart with our current situation..... we are currently short and so until we get a new high, the thought is to stay short. I have marked the high bar of the last closed blue segment. If the next open blue segment gives us a bar that closes with a higher value than this bar, then we will start looking for long trades, and we stay long until a red bar closes lower than that lowest bar on the last closed red segment.... as yo ucan see I am using a red horizontal line to help me easily recognize trade direction.
Okay, so now I hope I have adequately explained how I am determining trade direction.