A hello to all.
I guess I wanted to post a system I have been tinkering with for a few months now and see if anyone can point anything that may be wrong with it fundamentally that I may just be too close to see. All feedback is appreciated.
Chart Setup:
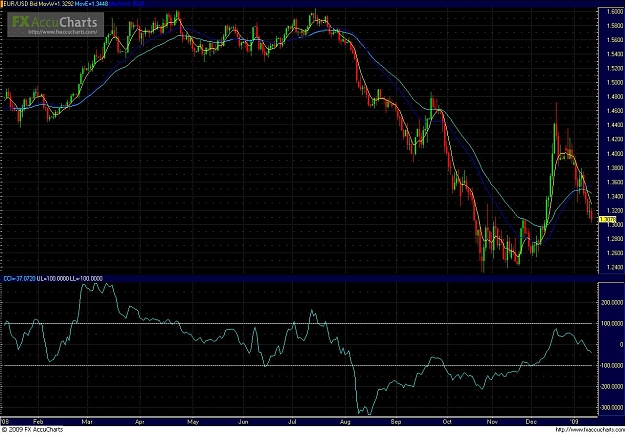
·Daily EUR/USD Chart.
·8 Period Weighted Moving Average on Closing Price
·40 Period Exponential Moving Average on Closing Price
·40 Period Weighted Moving Average on Closing Price
·90 Period Commodity Channel Index with Upper Band at 100 and Lower Band at -100.
Trade Execution:
·The system is a trend following system combining double moving average crosses and commodity channel trend breakouts.
·Because I am using two different 40 period moving averages there should be a separation between the moving averages, this provides a mechanized system to layer into positions. The entries are as follows:
oWhen the 8 WMA closes with a cross of one of the 40 MAs, you enter long or short 1 Unit in the direction of the 8 WMA.
oWhen the 8 WMA closes with a cross of second, lagged 40 MA, you enter another unit in the direction of the 8 WMA.
oWith this system you are intended to always be at least one unit in the market. Thus when the 8 WMA crosses back over the 40 MAs you close your current position and enter the reverse position.
oStop for Moving Average System: The system tells you when to get out, however I feel it is important to attempt to lock in the spread between the lagging 40 MAs when it is possible to do so. A rule to help this is when the second trade entered is +100 pips in profit, move the original trade stop to the entry of the second trade.
oTo use the 90 period CCI breakout you simply enter long or short one unit when the indicator closes across 100 or -100 accordingly. The exit is given when the indicator closes back over or below 50 or -50.
oAll trades are entered at the beginning of each trading day: 4 PM.
Hope this is clear. If you have any questions don't hesitate to post em up.
I guess I wanted to post a system I have been tinkering with for a few months now and see if anyone can point anything that may be wrong with it fundamentally that I may just be too close to see. All feedback is appreciated.
Chart Setup:
·Daily EUR/USD Chart.
·8 Period Weighted Moving Average on Closing Price
·40 Period Exponential Moving Average on Closing Price
·40 Period Weighted Moving Average on Closing Price
·90 Period Commodity Channel Index with Upper Band at 100 and Lower Band at -100.
Trade Execution:
·The system is a trend following system combining double moving average crosses and commodity channel trend breakouts.
·Because I am using two different 40 period moving averages there should be a separation between the moving averages, this provides a mechanized system to layer into positions. The entries are as follows:
oWhen the 8 WMA closes with a cross of one of the 40 MAs, you enter long or short 1 Unit in the direction of the 8 WMA.
oWhen the 8 WMA closes with a cross of second, lagged 40 MA, you enter another unit in the direction of the 8 WMA.
oWith this system you are intended to always be at least one unit in the market. Thus when the 8 WMA crosses back over the 40 MAs you close your current position and enter the reverse position.
oStop for Moving Average System: The system tells you when to get out, however I feel it is important to attempt to lock in the spread between the lagging 40 MAs when it is possible to do so. A rule to help this is when the second trade entered is +100 pips in profit, move the original trade stop to the entry of the second trade.
oTo use the 90 period CCI breakout you simply enter long or short one unit when the indicator closes across 100 or -100 accordingly. The exit is given when the indicator closes back over or below 50 or -50.
oAll trades are entered at the beginning of each trading day: 4 PM.
Hope this is clear. If you have any questions don't hesitate to post em up.