Unlike traditional moving averages, this indicator not only plots a trend-following moving average line, but also constructs dynamic upper and lower bands around the average. These bands represent the expected range of price fluctuations and provide additional context for market behavior.
https://cdn.tradingfinder.com/file/5...5-by-tflab.zip
https://www.forexfactory.com/thread/...cator-mt4-free
https://www.forexfactory.com/thread/...-in-metatrader
Prop Firm DrawDown Protector : Prop Firm Capital Protection Expert MT5 |Forex Money Management: Forex Trade Management Expert MT5 | ICT Concepts Indicator MT5 |Smart Money Concepts Expert MT5 | Smart Money Trap Scanner | Get a free Expert Advisor license via Telegram and WhatsApp
Specification of the Machine Learning Moving Average Indicator
The Machine Learning Moving Average Indicator is designed to support multiple trading strategies and financial markets.
Indicator Categories
- Signal & Forecast Indicators for MetaTrader 5
- Machine Learning Indicators for MetaTrader 5
- Moving Average Indicators for MetaTrader 5
Platform
- MetaTrader 5 Trading Platform
Trading Skill Level
- Elementary
Indicator Type
- Reversal Indicator
Timeframe Compatibility
- Multi-Timeframe Support
Trading Styles
- Swing Trading
- Scalping
- Day Trading
Supported Trading Instruments
- Forex Market
- Cryptocurrency Market
- Stock Market
- Commodities
- Market Indices
- Share Stocks
Machine Learning Moving Average Indicator at a Glance
Signal generation within the Machine Learning Moving Average indicator is primarily based on the relationship between price movement and the surrounding bands.
The indicator evaluates whether the price is breaking outside the statistical boundaries of the channel.
- When price moves above the upper band, the indicator interprets this as bullish momentum and produces a buy signal.
- When price falls below the lower band, the indicator identifies bearish pressure and produces a sell signal.
This logic allows traders to detect potential trend continuation or reversal zones with greater accuracy.
Buy Signal
In the Ethereum (ETH) chart on the 1-hour timeframe, the price breaks above the upper band and the candle closes above that level.
Under these conditions:
- The indicator recognizes the breakout structure.
- A blue marker appears on the chart.
- The signal suggests a potential buying opportunity.
Uptrend Analysis with the Machine Learning Moving Average Indicator
The breakout above the upper band often indicates strengthening bullish momentum. Traders can use this signal to:
- Confirm the beginning of a bullish trend
- Identify strategic entry points for buy positions
- Combine with additional technical confirmation tools
Identifying Entry Opportunities for Buy Trades
Potential entry zones appear after the breakout confirmation, especially when:
- The price consolidates above the upper band
- Momentum indicators confirm bullish pressure
Sell Signal
In the **GBP/USD chart on the 30-minute timeframe, the indicator identifies a price decline below the lower band.
In this scenario:
- The indicator detects bearish pressure in the market.
- A red marker appears on the chart.
- The signal highlights a potential selling opportunity.
Downtrend Analysis with the Machine Learning MA Indicator
The downward breakout below the lower band reflects increasing selling pressure.
This condition can be used to:
- Confirm bearish trend development
- Identify continuation patterns in declining markets
- Improve risk management during short positions
Identifying Reversal Zones
The lower band can also act as a critical volatility boundary. When price repeatedly interacts with this band, traders may identify:
- Potential reversal areas
- Strong bearish momentum zones
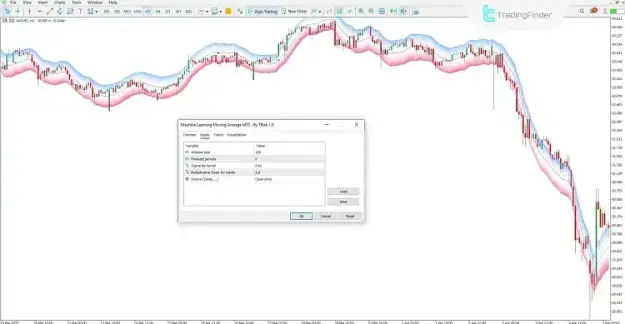
Settings of the Machine Learning Moving Average Indicator
The indicator includes several configurable parameters that allow traders to adjust its sensitivity and analytical depth.
Main Parameters
Window Size
- Defines the number of data points used for the moving average calculation.
Forecast
- Determines the level of predictive responsiveness of the indicator.
Sigma
- Represents the smoothing parameter or statistical standard deviation applied to price data.
Multiplicative Factor
- Controls the expansion or contraction of the surrounding bands.
Source
- Specifies the input price type used in the calculations.
Upperline
- Defines the upper boundary of the price fluctuation channel.
Lowerline
- Defines the lower boundary of the price fluctuation channel.
Conclusion
The Machine Learning Moving Average Indicator represents a modern evolution in algorithm-based technical analysis. Through the application of machine learning principles and statistical modeling, the indicator effectively filters the dominant market trend from unpredictable and volatile price movements.
Key advantages of this indicator include:
- Identification of the primary market direction
- Detection of breakout-based trading signals
- Visualization of volatility ranges through upper and lower bands
By combining a trend-tracking moving average with dynamic volatility bands, this indicator provides traders with a structured framework for identifying trend continuation, breakout opportunities, and potential reversal zones in financial markets.