The Bat pattern is composed of five primary points (X, A, B, C, D) and four connecting legs (XA, AB, BC, and CD). The most critical point in this structure is point D, located near the 88.6% Fibonacci retracement of the XA leg, where trade entry signals are typically generated.
You can access the indicator from this link:
https://tradingfinder.com/products/i...w/bat-pattern/
You can access the indicator on the TradingView website:
https://www.tradingview.com/script/t...art-Indicator/
Prop Firm DrawDown Protector : Prop Firm Capital Protection Expert MT4 | Forex Money Management: Forex Trade Management Expert MT4 |ICT Concepts Indicator MT4 | Smart Money Concepts Expert MT4| Smart Money Trap Scanner | Get a free Expert Advisor license via Telegram and WhatsApp
Key Features and Classification
This TradingView harmonic tool is suited for price action traders, harmonic analysts, and those using predictive technical patterns to forecast market reversals.
Indicator Categories
- Signal & Forecast Indicators
- Harmonic Pattern Indicators
- Classic & Chart Pattern Tools
Supported Platform
- TradingView
Skill Level
- Intermediate Traders
Indicator Type
- Reversal Pattern Indicator
Compatible Timeframes
- Multi-Timeframe Analysis
Suitable Trading Styles
- Intraday and Short-Term Trading
Applicable Markets
- Forex
- Cryptocurrencies
- Commodities
- Indices
- Stocks and Shares
Indicator Overview
The Bat Harmonic Pattern relies on asymmetrical Fibonacci ratios, with the 88.6% retracement of the XA leg serving as a critical level for pattern completion. Once point D is confirmed, the indicator issues Buy or Sell signals depending on the direction of the pattern.
Both bullish and bearish patterns are automatically drawn on the chart, accompanied by clear visual markers and alerts for timely trade execution.
Bullish Bat Pattern Example
In the 15-minute chart of Ethereum (ETH), the indicator detected a Bullish Bat Pattern:
- Point D was completed at the 88.6% retracement of the XA leg
- A green visual marker highlighted the bullish reversal zone
- A Buy signal was generated upon confirmation of the pattern
This setup offers a reliable opportunity to enter long positions in anticipation of an upward move.
Bearish Bat Pattern Example
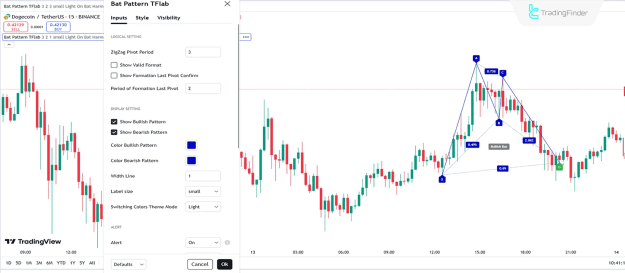
In the 15-minute chart of Dogecoin (DOGE), the Bearish Bat Pattern was identified:
- Point D aligned with the 88.6% retracement of the XA leg
- A red visual marker indicated the reversal zone
- A Sell signal was issued, marking a potential short entry zone
Such patterns are valuable for traders looking to anticipate trend exhaustion and reversal in bearish markets.
Indicator Settings and Customization
The Bat Harmonic Pattern Indicator includes customizable options for pattern recognition, appearance, and alerting features, enabling traders to tailor the tool to their preferences.
Adjustable Parameters Include:
- ZigZag Pivot Period: Controls the pivot point detection sensitivity (default set to 3)
- Show Valid Format: Filters noise and displays only valid pattern structures
- Confirm Last Pivot Formation: Displays the pattern after the final pivot is validated
- Last Pivot Formation Period: Sets calculation depth for the last pivot (default set to 2)
- Enable Bullish Pattern: Toggles the display of bullish Bat patterns
- Enable Bearish Pattern: Toggles the display of bearish Bat patterns
- Color Settings:
- Bullish Pattern Color
- Bearish Pattern Color
- Line Thickness and Style
- Label Size for Annotations
- Theme Mode: Allows switching between light and dark mode
- Alert Features:
- Enable alerts for new patterns
- Customize alert names and messages
- Set alert frequency
- Display alert time in UTC zone
Conclusion
The Bat Harmonic Pattern Indicator for TradingView is a precise, Fibonacci-based reversal tool that enables traders to identify high-probability entry zones at market turning points. By highlighting the critical point D with visual cues and customizable alerts, this indicator supports accurate timing in both bullish and bearish market conditions.
Whether trading Forex, crypto, stocks, commodities, or indices, this harmonic tool enhances technical forecasting through the power of structured pattern recognition.