TP & SL Tool: Risk Reward Ratio Calculator RRR MT4 | Prop Firm Protector: Trade Assist Prop Firm Plus TF Expert MT4 | Money Management + DrawDown Protector: Trade Panel Prop Firm Drawdawn Limiter Pro MT4 |Get a free Expert Advisor license via Telegram and WhatsApp
What Is Trend Reversal?
In technical analysis, price is in constant flux, at times moving in a clear direction, and at other times reversing unexpectedly. One of the most crucial decision points for traders is recognizing when a trend reversal occurs. Identifying these moments can be the defining factor between a profitable trader and one exposed to heightened risk.
Reversal trading focuses on scenarios where the prevailing market direction changes. For instance, when an uptrend (bullish movement) transitions into a downtrend (bearish movement), a reversal has taken place. Such reversals can occur across all timeframes—from minute charts to monthly charts.
When Does a Reversal Occur?
Reversals typically materialize in critical market zones where buying or selling pressure reaches an extreme, allowing the opposing force to assert dominance. Key signals indicating a potential trend reversal include:
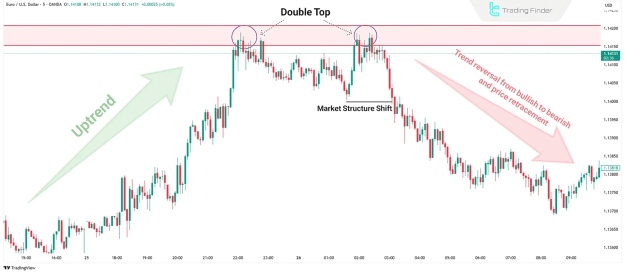
- Market Structure Shift (MSS): In an upward trend, failure to achieve a new high followed by a break below the previous low is a strong reversal signal.
- Loss of Momentum: Weakening momentum or diminishing continuation candles often indicate the existing trend is losing strength.
- Formation of Consolidation or Reversal Patterns: Patterns such as double tops/bottoms, head and shoulders, or specific reversal candlestick formations like pin bars and engulfing candles commonly emerge at pivotal turning points.
- Indicator Divergence: A disparity between price movement and indicators like the Relative Strength Index (RSI) or MACD signals a discrepancy between price action and underlying market strength.
Difference Between Reversal and Pullback
Reversals and pullbacks may visually appear similar but differ fundamentally in terms of trend continuation:
- Market Direction:
- Pullback: The existing trend continues.
- Reversal: The trend direction changes entirely.
- Duration:
- Pullback: Generally short-term in nature.
- Reversal: Often medium- to long-term.
- Price Objective:
- Pullback: Price resumes its previous trend after a temporary correction.
- Reversal: Price initiates a new trend in the opposite direction.
- Example in an Uptrend:
- Pullback: A temporary decline in price before continuing upward.
- Reversal: A sustained downward move that establishes a new bearish trend.
What Is a Reference Point in Reversal Trading?
A Reference Point serves as a crucial area where traders anticipate potential trend changes. These points are typically identified using prior price behavior or established technical analysis tools, including:
- Support and resistance levels
- Trendlines
- Moving Averages, such as the 200-period Moving Average (MA200)
- Supply and demand zones
Key Zones in Reversal Trading
Reference Points in Reversal Trading in Price Action
Three Methods to Identify a Trend Reversal
Reversals present significant opportunities for traders seeking optimal entry points. To enhance accuracy, experienced traders often integrate structural analysis with multi-timeframe evaluation. Three primary methods to identify potential reversals include:
Market Structure Shift (MSS)
During a healthy trend, price consistently forms higher highs and higher lows in an uptrend (or lower highs and lower lows in a downtrend). A failure to achieve a new high followed by a break below the preceding low is a significant signal that the trend may be reversing.
Reversal on Higher Timeframe
Signals visible on lower timeframes can sometimes produce false indications of reversals. To minimize the risk of false signals, traders should always confirm potential reversals by analyzing price action on higher timeframes.
Break of MA200
The 200-period moving average (MA200) is widely regarded as a critical tool for assessing trend direction. A decisive break below the MA200 typically signifies a potential shift toward a bearish trend, while a break above the MA200 suggests a bullish reversal.
Identifying Fake Reversals
False reversals are a significant cause of unnecessary stop-loss triggers. To avoid being misled by fake signals, traders should carefully consider:
- Multi-timeframe Confirmation: A reversal signal on a 5-minute or 15-minute chart should be validated against higher timeframes such as the 1-hour or 4-hour chart.
- Market Context: If price is moving within the middle of a trading range rather than at a critical zone, the reversal signal is less reliable.
- Candlestick Clarity: Reversal candles must be prominent and accompanied by significant volume. Weak or small candles can produce misleading signals.
The most effective defense against fake reversals is a combination of multi-timeframe analysis, candlestick interpretation, and validation around key zones.
Example of Short Reversal Trade
Consider the EUR/USD currency pair: if the price fails to achieve a new high and subsequently breaks the previous low, this serves as an early warning of a potential bearish reversal.
Instead of entering immediately based on signals from higher timeframes, traders often wait for confirmation on lower timeframes such as the 15-minute or 1-hour chart. Confirmation can include the formation of supply zones and reversal candlestick patterns like bearish engulfing candles or pin bars.
In such trades:
- A stop-loss is generally placed above the established supply zone.
- Profit targets often align with prior support or resistance levels.
Example – Long Reversal Trade
Following a steep decline in gold prices, many traders might anticipate further downward movement. However, if the decline is accompanied by:
- Divergence signals on key indicators,
- The emergence of reversal candlesticks,
- The development of a significant support zone,
there could be a high probability of a bullish reversal.
Traders should wait for price reactions within the support zone. Bullish signals might include engulfing candlesticks or consolidation patterns supported by significant volume. The establishment of a higher low often confirms a trend reversal to the upside.
Traders typically define targets based on key price levels or adhere to a favorable risk-reward ratio.
Conclusion
Reversal trading offers significant profit opportunities when executed with precision. The key to successful trading lies not merely in spotting unusual candlestick patterns but in accurately identifying when and where a trend reversal is developing.
Without concrete evidence—such as market structure shifts, indicator divergence, or higher timeframe validation—attempting reversal trades can expose traders to unnecessary risk.