TP & SL Tool: Risk Reward Ratio Calculator RRR MT5 | Prop Firm Protector: Trade Assist Prop Firm Plus TF Expert MT5 | Money Management + DrawDown Protector: Trade Panel Prop Firm Drawdawn Limiter Pro MT5 |Get a free Expert Advisor license via Telegram and WhatsApp
Definition of the RTM Diamond Pattern
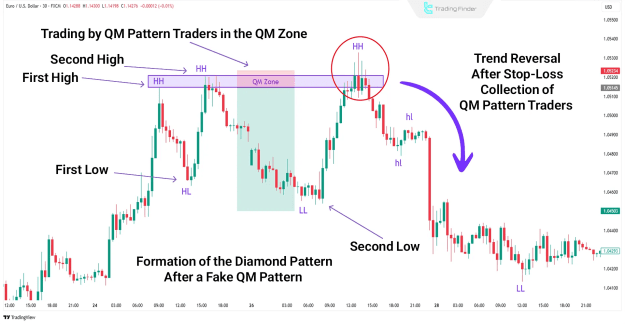
The Diamond Pattern forms after the Quasimodo (QM) pattern is invalidated. Instead of reacting as a traditional QM, price revisits the QM Zone, sweeps stop-loss orders, and then reverses direction. This deceptive move traps traders on both sides of the market, creating the diamond-shaped structure that signals an impending reversal.
Key Characteristics of the Diamond Pattern
In an RTM Diamond Pattern, stop-losses of five distinct trader groups are triggered:
- Sellers at the first high
- Buyers at the first low
- Sellers at the second high
- Buyers at the second low
- Sellers within the QM Zone
This orchestrated liquidity sweep sets the stage for a powerful reversal.
How to Identify the RTM Diamond Pattern
Spotting the Diamond Pattern requires a deep understanding of RTM supply and demand zones and the ability to distinguish between genuine and false breakouts.
Step 1: Locate Primary Supply & Demand Zones
- Master key RTM concepts such as FTR (Failed Trading Range), Flags, and DP (Displacement Points).
- Ensure price has tested the zone—even a minor breach confirms validity.
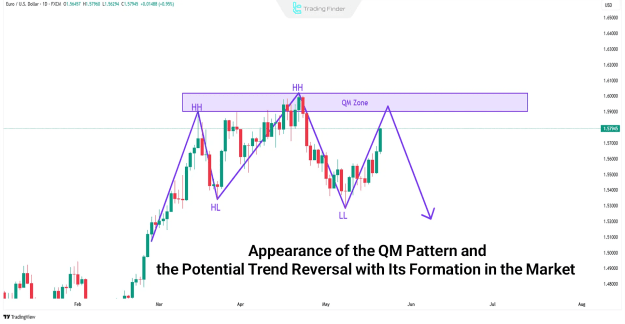
Step 2: Recognize the Quasimodo (QM) Pattern
- The QM typically forms before price reaches the primary zone.
- If the QM fails and stops are swept, the likelihood of a Diamond Pattern increases.
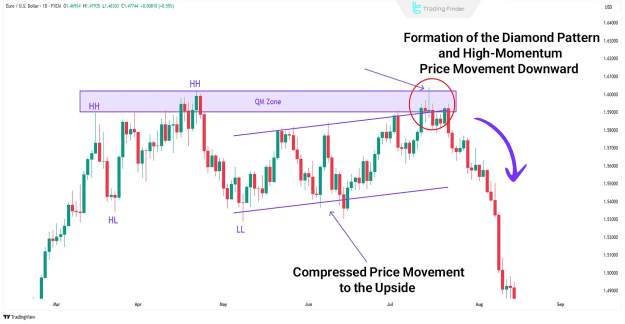
Step 3: Observe QM Violation & Compression (CP) Move
- After QM invalidation, price compresses (CP Move) inside the QM Zone.
- This consolidation often precedes a stop-run.
Step 4: Watch for a Fake Break or Aggressive Reaction
- Price aggressively sweeps stops via a fake breakout or long-wicked candles.
- This confirms liquidity collection by institutional players.
Step 5: Enter in the New Trend Direction
- After the fakeout, price reverses with strong momentum.
- Enter using candle confirmation or technical indicators, placing stops beyond the fake swing high/low.
- Take profit at subsequent support/resistance (SR) levels, anticipating a sustained reversal.
Example: Trading the RTM Diamond Pattern
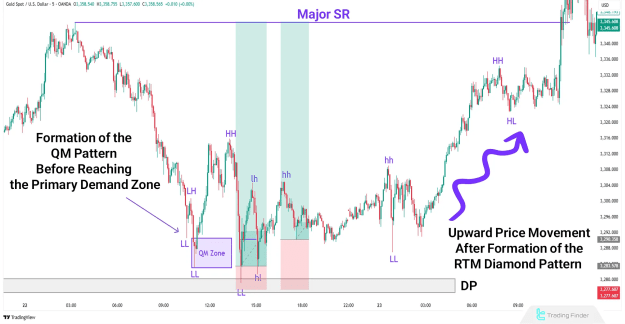
Consider a bullish reversal scenario on the EUR/USD chart:
- Price forms a QM pattern near a demand zone.
- Instead of reversing, it violates the QM, sweeps stops, and compresses.
- A fake breakdown occurs, trapping sellers.
- Price then reverses sharply, confirming the Diamond Pattern.
- Traders enter long, targeting higher SR levels.
Critical Considerations When Trading the Diamond Pattern
- The Diamond Pattern is most reliable when the QM has not yet reached the primary supply/demand zone.
- If unsure whether price will reach the primary zone, trading the initial QM is advisable.
- After a QM stop-run, professional traders watch for the Diamond Pattern as a secondary opportunity.
- Confirm the reversal with a break of minor SR or additional technical signals.
- Post-liquidity sweep, reversals often exhibit strong momentum—further validating the setup.
Conclusion
The RTM Diamond Pattern is a sophisticated reversal strategy used by institutions to trap retail traders. By mastering its structure—QM violation, liquidity sweep, and aggressive reversal—traders can capitalize on high-probability trend changes.
When executed correctly, this pattern offers exceptional risk-reward (R:R) opportunities, making it a valuable tool in a professional trader’s arsenal.