You can download it from this link:
https://cdn.tradingfinder.com/file/4...5-by-tflab.zip
https://www.forexfactory.com/thread/...cator-mt4-free
https://www.forexfactory.com/thread/...-in-metatrader
TP & SL Tool: Risk Reward Ratio Calculator RRR MT5 | Prop Firm Protector: Trade Assist Prop Firm Plus TF Expert MT5 | Money Management + DrawDown Protector: Trade Panel Prop Firm Drawdawn Limiter Pro MT5 |Get a free Expert Advisor license via Telegram and WhatsApp
Key Features of the Rainbow Multi Moving Average Indicator
- Utilizes 66 moving averages with different periods
- Applies various colors to create a rainbow-style visual structure
- Enhances clarity in recognizing market direction and trend strength
- Supports multiple trading styles and instruments
- Compatible with the MetaTrader 5 trading platform
Indicator Classifications
- Category: Currency Strength, Trading Assist, Momentum Indicators
- Indicator Type: Reversal Indicator
- Platform: MetaTrader 5 (MT5)
- Skill Level: Suitable for elementary to advanced users
- Timeframe Compatibility: Multi-timeframe support
- Trading Styles: Day trading, scalping, and swing trading
- Markets: Forex, Cryptocurrency, Stocks
Understanding Trend Behavior with Rainbow MMA
The Rainbow Multi Moving Average Indicator allows traders to determine trend direction by observing the slope and formation of its moving average lines:
Uptrend Conditions
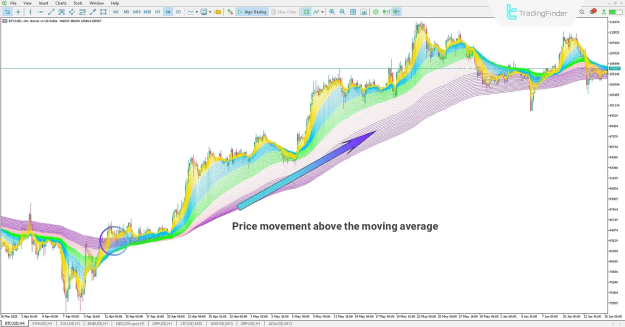
An uptrend is confirmed when price breaks above a compressed cluster of moving averages. As the price moves higher, the moving averages begin to separate and slope upwards, signaling strong bullish momentum.
Example Observation:
- On the 4-hour Bitcoin (BTC) chart, a breakout above the dense MA region indicates trend initiation.
- Consistent upward separation of the lines affirms sustained buying pressure.
Downtrend Conditions
A downtrend is identified when the price moves below the tightly packed MA lines and continues to pass through them. A downward slope in the moving averages indicates that bearish sentiment is gaining strength.
Example Observation:
- On the 1-hour Solana (SOL) chart, a break below the MA compression zone marks the beginning of a bearish trend.
- As the lines fan downward, it confirms negative market momentum.
Visual Trend Analysis with Rainbow MMA
The visual structure formed by the rainbow-colored moving averages simplifies trend recognition. The angle and alignment of the lines
Provide immediate cues:
- Upward Angles: Indicate bullish trends
- Downward Angles: Suggest bearish trends
- Compressed Zones: Signal potential breakout or reversal zones
Indicator Settings and Customization
The Rainbow Multi Moving Average Indicator offers a flexible configuration panel, enabling traders to customize it based on their strategies.
Adjustable Parameters:
- MA Type: Selects the type of moving average (e.g., EMA, SMA)
- MA Price: Sets the price base (Close, Open, High, Low) for calculation
- MA Periods: Customize up to 33 moving average periods (used to derive 66 lines)
This flexibility allows for tailored trend analysis across different instruments and trading approaches.
Conclusion
The Rainbow Multi Moving Average Indicator is a sophisticated tool that overlays a spectrum of exponential moving averages to form a visually rich trend analysis environment. By integrating long, medium, and short-term MAs, it provides a multi-layered view of price action.
Its application spans across Forex, Cryptocurrency, and Stock markets, making it a valuable resource for traders seeking precise and intuitive market trend insights. With its well-structured design and adjustable parameters, the Rainbow MMA is particularly effective for identifying momentum shifts, trend continuations, and potential reversals.