https://cdn.tradingfinder.com/file/3...5-by-tflab.zip
https://www.forexfactory.com/thread/...icator-for-mt4
https://www.forexfactory.com/thread/...-in-metatrader
TP & SL Tool: Risk Reward Ratio Calculator RRR MT5 | Prop Firm Protector: Trade Assist Prop Firm Plus TF Expert MT5 | Money Management + DrawDown Protector: Trade Panel Prop Firm Drawdawn Limiter Pro MT5 |Get a free Expert Advisor license via Telegram and WhatsApp
Core Features and Classifications
- Indicator Categories:
- Support & Resistance Indicators
- Forecast & Signal Indicators
- Price Level Indicators
- Platform Compatibility:
- MetaTrader 5 (MT5)
- User Skill Level:
- Elementary to Intermediate
- Indicator Types:
- Breakout Detection
- Reversal Signal
- Timeframe Usage:
- Multi-Timeframe Analysis
- Applicable Trading Styles:
- Swing Trading
- Scalping
- Fast Scalping
- Day Trading
- Target Instruments:
- Forex
- Cryptocurrencies
- Commodities
- Stocks & Shares
- Indices
Trading Signal Logic
- The indicator monitors market price movements and reacts when the price crosses either the upper or lower boundary of the visualized box.
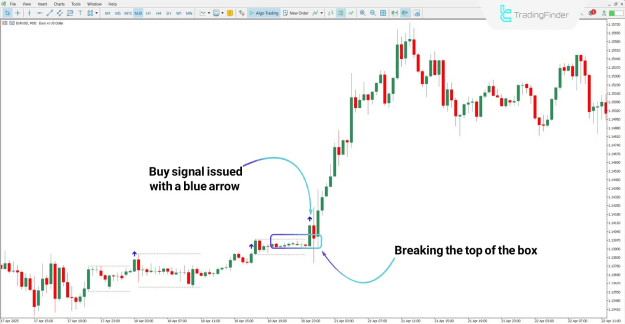
- When a bullish breakout occurs, the indicator shows a blue arrow, signaling a buy entry.
- In the case of a bearish breakout, a pink arrow is displayed, signaling a sell opportunity.
- This visual simplicity offers fast decision-making support, especially in volatile or high-momentum environments.
Buy Signal Example
In a 30-minute EUR/USD chart, a significant bullish move is observed after the price breaks above the upper boundary of the range. The indicator detects this breakout and places a blue arrow on the chart, confirming a potential buy position aligned with the uptrend.
Sell Signal Example
On the 1-hour chart of Silver (XAG/USD), price action breaks below the lower box boundary and closes outside the defined range. The indicator responds by showing a pink arrow, suggesting a sell signal and highlighting a bearish continuation pattern.
Settings Overview for Customization
- PreviousCandle – Determines the reference candle for breakout calculation.
- The Highest Box Height (Pipet) – Defines the height of the box using pipet values.
- The Largest Box Size (Candle) – Sets the number of candles used to construct the box.
- Shift – Offsets the box to the right by a specified number of candles.
- BoxColor – Selects the color of the box borders.
- BoxStyle – Defines the border line style (solid, dashed, etc.).
- Box Width – Adjusts the thickness of the box border lines.
Conclusion
The Breakout Box with Arrow Indicator offers a structured and visual approach to identifying key breakout zones in various asset classes. Through colored arrows, it delivers immediate trade signals based on price action dynamics. Compatible with multiple trading strategies and timeframes, this indicator enhances technical analysis by clearly marking breakout points and potential trade opportunities. Its adaptable settings also allow traders to fine-tune performance based on personal strategy preferences.