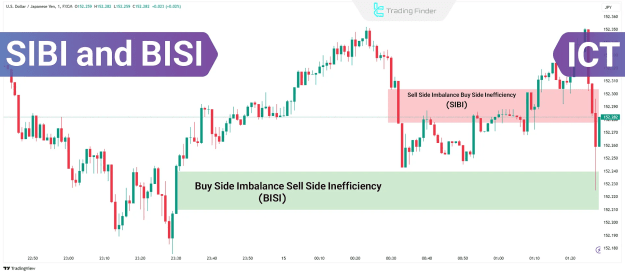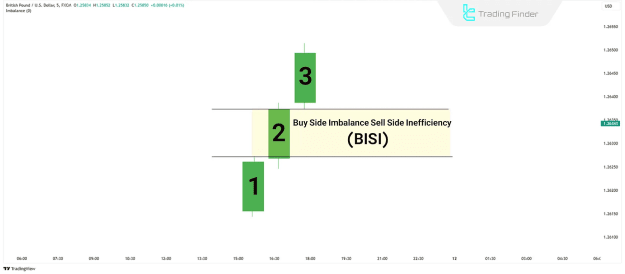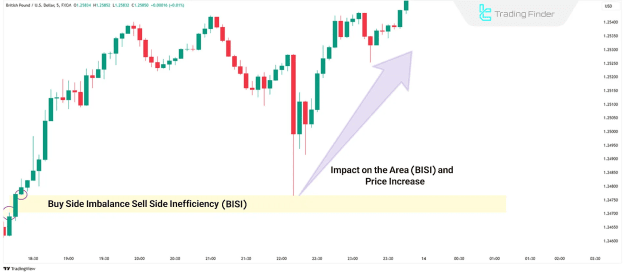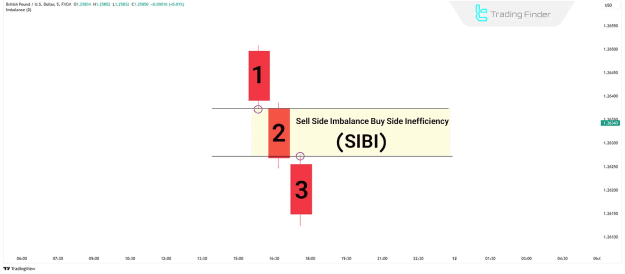


Both SIBI and BISI consist of three candlesticks, where the first and third candles align with the trend, reinforcing the imbalance. Understanding these structures is crucial for Forex traders looking to refine their technical analysis skills. These formations act as critical market structure points, offering high-probability trade setups that align with institutional order flow principles.
By mastering SIBI and BISI patterns, traders gain deeper Forex education insights into market inefficiencies, allowing them to spot potential continuation zones with greater confidence. These concepts are particularly valuable when combined with other ICT strategies, such as order blocks and liquidity analysis, to build a robust trading framework.
TP & SL Tool: Risk Reward Ratio Calculator RRR MT5 | Prop Firm Protector: Trade Assist Prop Firm Plus TF Expert MT5 | Money Management + DrawDown Protector: Trade Panel Prop Firm Drawdawn Limiter Pro MT5 |Get a free Expert Advisor license via Telegram and WhatsApp
What Is Buy-Side Imbalance and Sell-Side Inefficiency (BISI)?
Definition of BISI
BISI represents a bullish imbalance, indicating strong buying pressure in the market. This pattern forms when demand overwhelms supply, creating a gap that signals continuation potential.
BISI Structure Breakdown
The BISI pattern consists of three candlesticks:
- First Candle – A large bullish candle, signaling the start of aggressive buying.
- Second Candle – Another strong bullish candle, confirming buying momentum.
- Third Candle – Extends the uptrend, leaving a gap between the first candle’s high and the third candle’s low.
This gap signifies a strong imbalance where buyers dominate, and sellers struggle to regain control.
How to Trade BISI Patterns
- Identify the Setup – Look for three consecutive bullish candles with a clear gap.
- Confirm Buying Pressure – Ensure volume and momentum support the uptrend.
- Enter Long – Trade the continuation, placing a stop-loss below the gap.
- Target Key Levels – Use resistance zones or previous highs for take-profit areas.
What Is Sell-Side Imbalance and Buy-Side Inefficiency (SIBI)?
Definition of SIBI
SIBI is a bearish imbalance, reflecting strong selling pressure. This pattern emerges when supply exceeds demand, leading to a downward gap and potential further declines.
SIBI Structure Breakdown
The SIBI pattern consists of three candlesticks:
- First Candle – A large bearish candle, indicating strong selling pressure.
- Second Candle – Another bearish candle, confirming the downtrend.
- Third Candle – Extends the decline, creating a gap between the first candle’s low and the third candle’s high.
This gap highlights an inefficiency where sellers dominate, and buyers fail to reverse the trend.
How to Trade SIBI Patterns
- Spot the Pattern – Identify three consecutive bearish candles with a visible gap.
- Confirm Selling Pressure – Check for high volume and bearish momentum.
- Enter Short – Trade the downside, setting a stop-loss above the gap.
- Target Support Levels – Use previous lows or liquidity zones for profit-taking.
Key Differences Between SIBI/BISI and Fair Value Gaps (FVG)
While SIBI and BISI resemble Fair Value Gaps (FVG), they differ in structure and context:
- Trend Strength – SIBI/BISI occur in strong trending markets, whereas FVGs can form in any condition.
- Candle Alignment – In SIBI/BISI, the first and third candles align with the trend, reinforcing the imbalance. FVGs may not always follow this structure.
- Trading Implication – SIBI/BISI act as continuation signals, while FVGs can indicate both reversals and continuations.
Best Practices for Trading SIBI and BISI
- Combine with Order Blocks – Increase accuracy by aligning SIBI/BISI with order block zones.
- Use Proper Risk Management – Always set stop-loss and take-profit levels.
- Wait for Confirmation – Avoid premature entries; look for additional signals like break of structure (BOS) or liquidity sweeps.
- Analyze Higher Timeframes – SIBI/BISI patterns are more reliable on higher timeframes (4H, Daily).
Conclusion
SIBI and BISI are powerful concepts in ICT trading, helping traders identify high-probability imbalance zones. These patterns act as continuation signals in strong trends, providing clear entry and exit points.
By understanding their structure and integrating them with other technical tools, traders can enhance their strategy and improve decision-making. Always remember to validate setups with additional confirmation and maintain disciplined risk management.