What is Top-Down Analysis?
Top-Down Analysis begins with the examination of higher timeframes to determine macroeconomic trends and significant price levels. Traders then progressively shift to lower timeframes to fine-tune their entry and exit strategies. This technique improves market comprehension, supports strategic decision-making, and aids in effective risk mitigation.
Benefits of Top-Down Analysis
The Key Advantages of Implementing Top-Down Analysis:
- Clear Market Structure: Offers a broad perspective of market trends and directional bias
- Precision in Entries and Exits: Facilitates identification of accurate trade levels
- Enhanced Risk Management: Aligning trades with higher timeframe trends decreases overall trading risk
How to Perform Top-Down Analysis?
The Top-Down Analysis process involves sequential analysis of multiple timeframes, starting from the higher frames and moving to the lower ones for entry refinement.
#1 Daily Timeframe (D1)
On the daily chart, traders should:
- Identify significant price levels, including:
- Order Blocks (OBs)
- Fair Value Gaps (FVGs)
- Previous highs and lows
- Highlight zones of importance such as:
- Support and resistance levels
- Liquidity pools
#2 4-Hour Timeframe (H4)
On the H4 chart, the objective is to:
- Confirm the validity of levels marked on the daily timeframe
- Focus on FVGs or OBs that correlate with the daily structure
- Incorporate session-based analysis, such as:
- New York Kill Zone
- London Open/Close dynamics
#3 1-Hour Timeframe (H1)
The H1 timeframe is used to:
- Validate how price action interacts with zones from the higher timeframes
- Confirm the overall market bias and observe transitional structure behavior
#4 15-Minute Timeframe (M15)
On the 15-minute chart, traders should:
- Monitor price reactions to pre-identified higher timeframe levels
- Identify:
- Liquidity grabs
- Displacement moves
- FVG interactions
#5 Lower Timeframes (M5 & M1)
For entry execution and precision, M5 and M1 are analyzed by:
- Spotting actionable trade setups such as:
- Break of Structure (BOS)
- Change of Character (CHOCH)
- Mitigation Blocks
- Utilizing these timeframes for:
- Exact entry confirmation
- Risk minimization
- High R/R trade opportunities
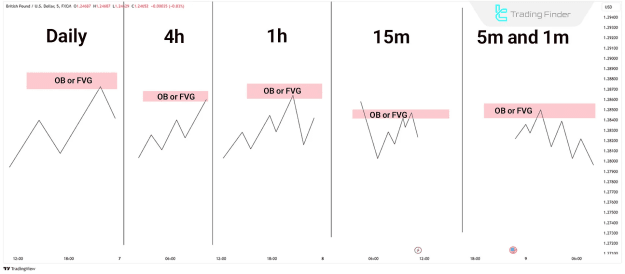
Top-Down Analysis Process
A structured flow of Top-Down Analysis moves from the identification of directional bias on higher timeframes to the precise execution on the lower timeframes. This cascading process ensures alignment and consistency across all chart perspectives.
Example of Using Top-Down Analysis
In a GBP/USD scenario, the trader initially identifies a valid Order Block and Fair Value Gap on the higher timeframes (D1/H4). As price approaches these levels, confirmation is sought on the M1 chart where a market structure shift occurs. Upon confirmation, a low-risk, high-probability entry is executed in alignment with the higher timeframe bias.
Trade Example: GBP/USD Top-Down Analysis Strategy
A practical illustration of this methodology demonstrates how a higher timeframe OB or FVG, once validated on lower timeframes with structure shifts or liquidity sweeps, offers a precise trade entry with optimal risk management.
Conclusion
Top-Down Analysis serves as a disciplined trading approach for recognizing macro and micro market trends, allowing traders to locate high-probability trade setups effectively.
By beginning with higher timeframes and methodically moving to lower timeframes, this strategy ensures enhanced trade accuracy, reduced risk exposure, and improved execution efficiency within the ICT trading methodology.