Introduction to 7 Technical Analysis Indicators
In the domain of technical analysis for financial markets such as the Forex market, technical indicators are predominantly employed to determine the prevailing long-term trend. The following sections introduce seven widely-used technical analysis indicators that assist traders in evaluating market dynamics:
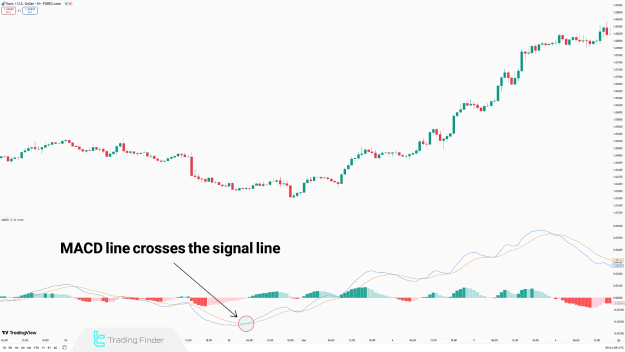
MACD Indicator
The MACD (Moving Average Convergence Divergence) is a momentum-based indicator classified under oscillators. It is utilized to detect trend reversals and momentum shifts, making it valuable for medium- to long-term market analysis.
MACD Signal Types
The MACD generates three core types of trading signals:
- Crossover between the MACD line and the Signal line
- Crossing above or below the Zero line
- Divergence between price and MACD
The MACD provides more reliable signals when aligned with the broader market trend or when combined with tools like support and resistance levels or classic chart patterns.
RSI (Relative Strength Index)
The RSI is a momentum oscillator that measures the strength and speed of recent price changes. It operates on a scale from 0 to 100 and is primarily used to determine overbought and oversold market conditions.
RSI Signal Types
Although frequently applied to long-term analysis, the RSI offers two key signals:
- Identifying potential reversal zones through overbought or oversold levels
- Detecting divergence between price action and the RSI
The RSI should not be used in isolation; it is most effective when complemented with price action strategies.
Ichimoku Indicator
The Ichimoku Kinko Hyo, often referred to as Ichimoku, is a comprehensive Japanese indicator that delivers insights into trend direction, momentum, and support/resistance levels. It comprises five main components:
- Tenkan-sen (Conversion Line)
- Kijun-sen (Base Line)
- Senkou Span A (Leading Span A)
- Senkou Span B (Leading Span B)
- Chikou Span (Lagging Span)
Ichimoku Signal Types
Ichimoku produces several signals, with three being particularly significant:
- Tenkan-sen crossing Kijun-sen
- Price crossing above or below the Kumo (cloud)
- Chikou Span appearing above or below the current price
Uniquely, Ichimoku is often sufficient on its own and does not always require additional indicators.
Moving Average (MA)
The Moving Average is a trend-following tool that smooths out price fluctuations, allowing traders to discern the general direction of the market. It is also instrumental in identifying reversal zones and dynamic support/resistance areas.
Types of Moving Averages
- Simple Moving Average (SMA)
- Exponential Moving Average (EMA)
Moving Average Signal Types
This indicator offers key signals through:
- Price crossing above or below the Moving Average
- Crossovers between two Moving Averages with different periods
- The slope direction of the Moving Average line
Due to its flexibility, the Moving Average is highly compatible with various trading systems and strategies.
Bollinger Bands
Bollinger Bands are a volatility-based indicator that comprises a Simple Moving Average flanked by upper and lower bands. These bands expand and contract based on historical price volatility.
Bollinger Bands Signal Types
The indicator provides trading signals via:
- Price touching or breaching the bands
- Bands widening or narrowing to indicate volatility changes
- Price oscillating within the band range
Bollinger Bands are particularly useful for detecting breakouts, price squeezes, and extreme market conditions.
Average True Range (ATR)
The ATR (Average True Range) measures market volatility over a specified period. While it does not indicate price direction, it helps assess the strength of price movements and is often used for risk management.
ATR Usage in Technical Analysis
- Confirms the intensity of price movements
- Filters trade entries and exits
- Enhances the accuracy of other indicator signals
As ATR lacks directional bias, it is best used alongside other trend-based or momentum indicators.
SuperTrend
The SuperTrend is a trend-following indicator based on the ATR and current price. It is overlaid directly on the chart and is suitable for all timeframes, offering clear signals for entries and exits.
SuperTrend Signal Types
This indicator issues signals in the following ways:
- Change in the color of the SuperTrend line
- Position shift of the line relative to price
- Widening or narrowing gap between price and the indicator
SuperTrend is especially beneficial for trend tracking and systematic trading.
Pros and Cons of Technical Analysis Indicators
While technical indicators are powerful tools, their effectiveness depends on the market conditions, trading strategy, and timeframe in use. Each indicator offers unique advantages and disadvantages:
Pros
- Simplifies complex price movements
- Enhances structured decision-making
- Compatible with other analysis strategies
- Assists with effective risk management
- Useful in automated trading systems
Cons
- Signals may lag, especially in fast markets
- Can generate false signals in ranging conditions
- Highly sensitive to input settings
- May lead to overconfidence
- Often disregards broader market context
Conclusion
Selecting appropriate technical indicators requires a thorough understanding of market structure, volatility, and the current price phase. Combining multiple indicators can improve signal reliability. For example, merging RSI divergence with MACD crossovers can effectively capture momentum shifts in slower-moving trends.
However, all indicators are rooted in historical data, which inherently limits their predictive power. Thus, traders should use them as part of a broader, well-rounded trading strategy.