This price action pattern integrates structural breaks and false breakouts, frequently emerging near critical zones such as support and resistance levels.
Quasimodo Pattern (QM Pattern) Indicator:
Quasimodo Pattern (QM Pattern) Indicator MT4
Quasimodo Pattern (QM Pattern) Indicator MT5
Definition of the Quasimodo (QM) Pattern
Also referred to as the Over and Under pattern, the QM structure consists of a five-step formation that reflects a shift in market momentum.
Key Steps in the QM Pattern:
- Formation of an initial high or low
- Creation of a new low or high, opposite to the initial level
- Breakout with a Higher High (HH) or Lower Low (LL) beyond the previous extreme
- Price retracement to form a new low or high, below or above the previous one
- A final return to the initial level without breaking it
This configuration signals a weakening trend and suggests the beginning of a reversal phase.
QM Pattern in a Downtrend
In a bearish scenario, the Quasimodo pattern illustrates the market structure before a bullish reversal.
Key Elements:
- "H" denotes swing highs
- "L" denotes swing lows
The final retracement fails to surpass the previous high, providing a low-risk sell opportunity.
Steps to Identify the Quasimodo Pattern
To accurately identify the QM pattern on a chart, follow these steps:
- Analyze the previous trend: Determine if the market is trending upward or downward
- Watch for structural shifts: Identify where the market forms new highs or lows at key zones
- Locate the retracement point: Confirm that price returns to the origin level without breaching it
This final retracement often acts as a confirmation point for trade entries.
QM Pattern in an Uptrend
In a bullish environment, the Quasimodo pattern helps detect a potential bearish-to-bullish reversal.
Observations:
- Price first forms a Higher High (HH)
- A subsequent Lower Low (LL) follows
- Price retraces back to the key zone without exceeding the original low, offering a buy signal
How to Trade the Quasimodo Pattern
The QM pattern can serve as a powerful trading strategy when executed correctly.
Step-by-Step Trading Method:
- Determine the trend:
- Identify if the market is in an uptrend or downtrend
- Identify if the market is in an uptrend or downtrend
- Mark significant highs and lows:
- Focus on areas where price breaks structure and later returns
- Entry strategy:
- For sell trades: Enter near the retracement of the most recent high
- For buy trades: Enter near the retracement of the most recent low
- Risk management:
- Place stop-loss orders just above the HH (for sells) or below the LL (for buys)
- Use a favorable risk-to-reward ratio, such as 1:3
Practical Example of the QM Pattern
Consider a market in an uptrend:
- Price forms a High (H) and then a Low (L)
- It climbs further to create a Higher High (HH)
- A sharp drop occurs, forming a Lower Low (LL)
- The price retraces to the initial high but fails to break it
This presents an ideal condition to initiate a short position, placing the stop-loss above the HH.
Real Example: QM Pattern in a Downtrend
In a downtrend, the opposite pattern occurs. The market:
- Prints a Low (L) and a subsequent High (H)
- Forms a Lower Low (LL)
- Retraces to the previous high without exceeding it
This structure is a potential buying setup at the base of a bearish cycle.
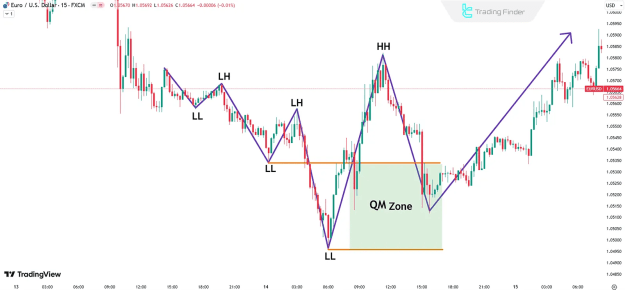
Real Example: QM Pattern in an Uptrend
In this scenario:
- The price forms a Higher High (HH)
- Retraces to the Quasimodo zone
- Then resumes the upward movement
This reflects a bullish confirmation and provides a reliable entry opportunity for long positions.
Key Points to Remember When Using the QM Pattern
- Supply and demand zones enhance the reliability of the QM pattern
- The distance between HH and LL should be moderate to ensure a favorable risk-to-reward ratio
- This pattern works best when combined with other technical tools, such as divergence, trendlines, or key levels
Conclusion
The Quasimodo Pattern in the RTM style is a price-action based reversal pattern that offers high-accuracy trading signals. Its effectiveness lies in its ability to reflect the internal shifts in market structure, making it applicable across various timeframes and markets.
By integrating this pattern with disciplined risk management and technical confluence, traders can significantly improve their chances of capturing market reversals with optimal entry points.