This indicator is ideal for traders looking to leverage Fibonacci-based structures for high-precision analysis in intraday and multi-timeframe strategies.
you can access the indicator from this link :
https://tradingfinder.com/products/i...abcd-harmonic/
for access to the indicator on the tradingview website:
https://www.tradingview.com/script/F...ern-indicator/
Key Characteristics and Trading Benefits
- Automatically identifies ABCD harmonic patterns
- Detects bullish and bearish reversal signals
- Highlights potential reversal zones (PRZ) using Fibonacci ratios
- Suitable for intermediate-level traders
- Compatible with Forex, stocks, and cryptocurrency markets
- Provides signals with clear visual markers: green for buy, red for sell
- Enables strategic decision-making in trending and corrective market phases
Indicator Categories and Applications
- Signal & Forecast Trading Indicators
- Harmonic Trading Indicators
- Chart Patterns and Classic Technical Indicators
- Reversal Pattern Indicators
- Multi-Timeframe Trading Tools
- Forward TradingView Indicators
The ABCD Harmonic Pattern Indicator is designed for use across multiple asset classes, including Forex, cryptocurrencies, stocks, and derivative instruments.
Structure and Function of the ABCD Pattern
The ABCD Harmonic Pattern is built on the principle of geometric price symmetry and Fibonacci measurements. It consists of:
- Wave AB: The first directional move
- Wave BC: A corrective move in the opposite direction of AB
- Wave CD: A continuation wave aligned with AB’s direction
- Point D: The final projection level, often acting as the potential reversal zone
Typically, point C retraces between 0.382 and 0.886 of the AB wave, while wave CD extends between 1.13 and 2.618 of wave BC. The convergence at point D is where the indicator signals a high-probability reversal.
Uptrend Example
In a 1-hour Bitcoin (BTC) chart, the pattern begins with a downward wave AB, followed by an upward corrective wave BC. This retracement generally ranges between 0.861 and 1.162 of the AB leg. As the pattern continues with a bearish CD wave, the price reaches point D. Upon confirming this PRZ, the indicator issues a Buy signal for potential long entry.
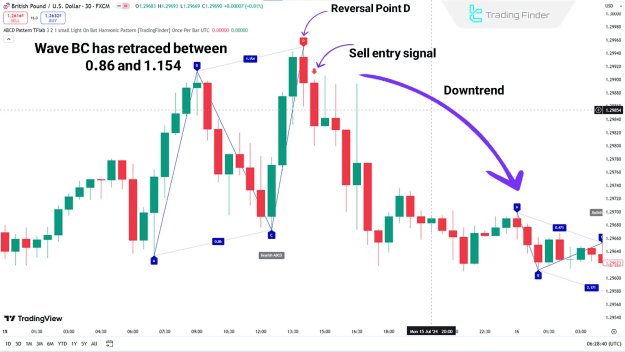
Downtrend Example
In a 30-minute chart of the GBP/USD currency pair, the ABCD pattern initiates with a bullish AB wave. The subsequent BC wave retraces downward, typically between 0.86 and 1.154 of AB. After this correction, the final CD wave extends upward to point D. At this PRZ, a Sell signal is generated, marking the potential onset of a bearish trend.
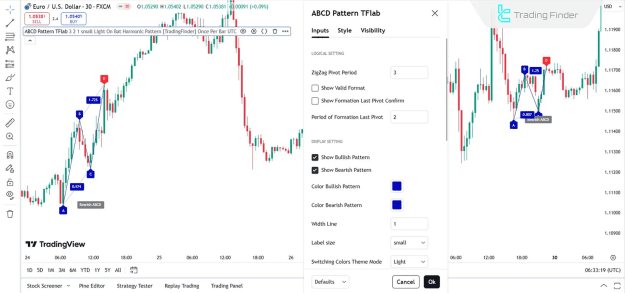
Customizable Settings of the Indicator
The indicator provides flexible configuration options to tailor its visual and alert preferences:
- ZigZag Pivot Period: Sets the pivot point calculation interval (default: 3)
- Show Valid Format: Filters and displays only valid harmonic patterns
- Formation Pivot Confirmation: Enables confirmation of the last pivot
- Display of Bullish/Bearish Patterns: Toggle visibility for each pattern type
- Color Customization: Assign specific colors to bullish and bearish patterns
- Line Width and Label Size: Adjust line thickness and text size
- Theme Mode Switching: Customize chart appearance with light or dark themes
- Alert System:
- Create named alerts for pattern formations
- Define message frequency
- Show alert timing adjusted by time zone
Conclusion
The ABCD Harmonic Pattern Indicator is a precision-based analytical tool designed to detect harmonic reversal patterns using Fibonacci ratios. By identifying Potential Reversal Zones (PRZ) on the price chart, this indicator supports data-driven trading decisions in a wide range of financial markets.
Its user-friendly design, customizable settings, and integration with TradingView make it a valuable asset for traders seeking to optimize entries and exits based on harmonic principles.