The bullish Three Drive pattern emerges when the market forms three consecutive lower lows, whereas the bearish Three Drive pattern is confirmed through the formation of three successive higher highs.
This indicator enhances price action trading by allowing users to easily spot this classic reversal structure and enter trades at potential reversal points.
You can access the indicator from this link:
https://tradingfinder.com/products/i...w/three-drive/
You can access the indicator on the TradingView website:
https://www.tradingview.com/script/9...ern-Indicator/
Key Characteristics of the Three Drive Indicator
- Category: Harmonic Patterns, Price Action, and Chart Patterns
- Platform: TradingView
- Skill Level: Intermediate
- Indicator Type: Reversal, Leading, Entry-based
- Timeframe Compatibility: Multi-timeframe
- Trading Styles: Scalping, Day Trading, Intraday Trading
- Markets: Forex, Commodities, Indices
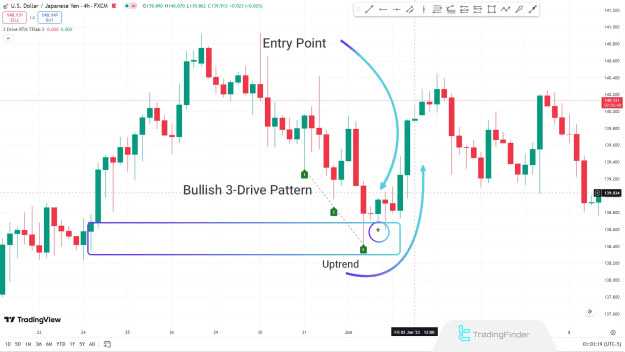
Bullish Three Drive Pattern
Example: USD/JPY – 4-Hour Chart
In the 4-hour chart of USD/JPY, price action approaches a significant support level and forms a bullish Three Drive pattern, signaling a potential reversal. This formation reflects a weakening in selling pressure and a growing dominance of buyers.
- The indicator identifies the pattern and issues a buy signal after the third low forms within the support area.
- Each low in the pattern penetrates the previous one, with the third low forming inside the area of the second, indicating diminishing bearish momentum.
- RTM-style traders can capitalize on the reversal by entering long positions upon the full confirmation of the pattern.
- The profit target is typically set near the origin of the downtrend or the highs created during the structure’s formation.
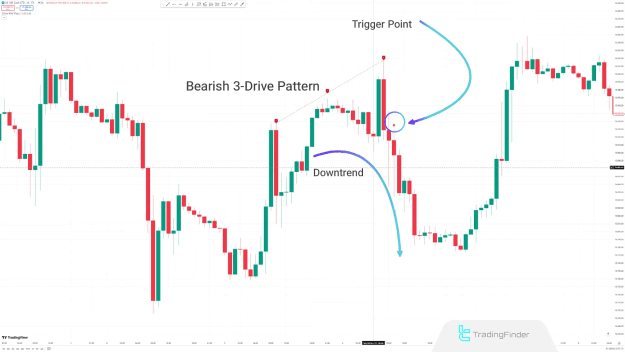
Bearish Three Drive Pattern
Example: NASDAQ (US100) – 1-Hour Chart
On the 1-hour NASDAQ chart, the price ascends and eventually forms a bearish Three Drive pattern, which is promptly identified by the indicator. The signal suggests a shift in market sentiment from bullish to bearish.
- This pattern develops during an uptrend, where each successive high breaks above the previous one.
- After the third high is confirmed, the indicator plots the structure and issues a sell signal.
- Traders can execute a sell position as the pattern indicates a potential trend reversal to the downside.
- This early signal allows for strategic entries before major price declines occur.
Indicator Configuration
Example: Bitcoin (BTC) – 1-Hour Chart
- Pivot Period Setting: Adjusts the sensitivity of the indicator by defining the reversal axis.
- This setting is essential for refining entry accuracy and aligning the pattern detection with actual market structure.
Summary
The Three Drive Harmonic Pattern Indicator serves as a reliable leading indicator for trend reversals. It enables traders to enter positions with greater precision following the formation of well-defined harmonic structures.
While the pattern can act as a standalone entry strategy, incorporating it within supply and demand zones or key support and resistance levels enhances its effectiveness and minimizes risk. This contextual approach significantly improves trade success rates and supports robust risk management.