So i want to introduce one of our new systems to you . We are dropping a free version at the community here . Go to bottom of the page to download the free version.
This indicator scans the breakout of congestion zones . This indicator unlike any other congestion indicator you will find in the market right now, it uses an advanced algorithm not peculiar to most traditional congestion indicators available today . The advanced algorithm used to define the congestions is greatly responsible for the high rate real congestion zones and low rate fake congestion zones spotted by this product.
UNDERSTANDING CONGESTION
Congestion are areas in the market where the bull and the bear match each other strength for strength , when this power struggle between supply (bull) and demand (bear) comes to an end, the victor usually define the new market trend. This makes congestion zones one of the best places to enter a trade in a market.
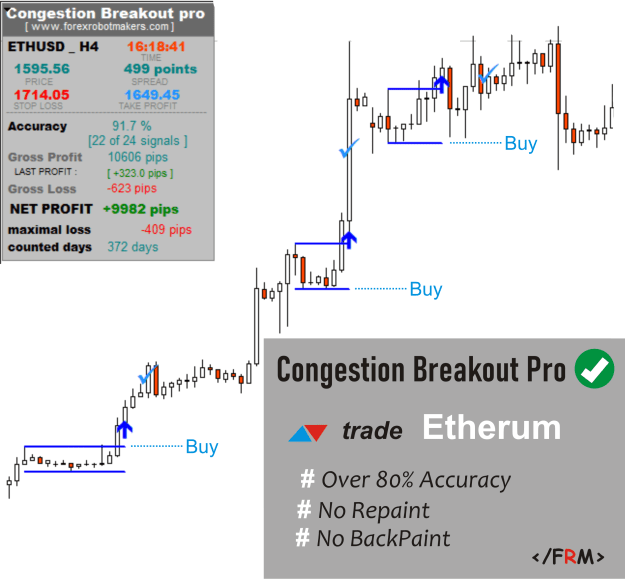
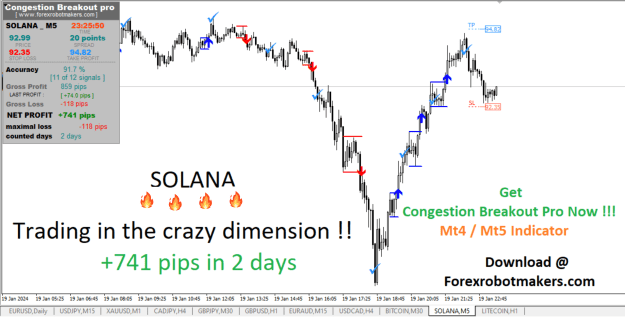
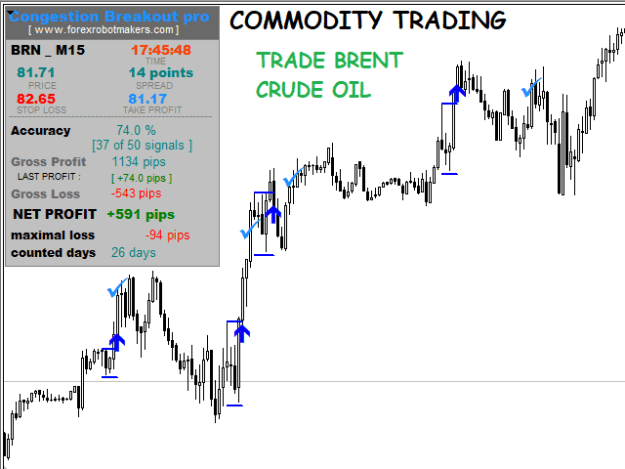
STATISTICS DASHBOARD INFORMTION
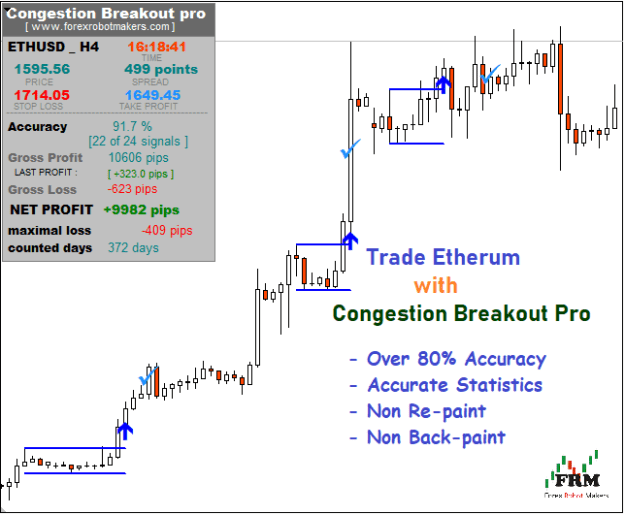
Some of the information given by the statistics dashboard includes :
1.) Current Stop Loss & Take Profit : The stop loss and take profit of the current pattern formed is shown on the stats.
2.) Accuracy : The accuracy of all signals is calculated as the percentage of the total signals that were profitable.
Accuracy = (Profitable Signals /Total Signals)*100
Also along with the accuracy calculated the profitable signals and the total signals counted are also displayed for transparency.
3.) Gross Profit (pips) : The gross profit in pips is the total profit in pips generated from the signals before excluding the losses.
Gross Profit = profit( trade 1 ) +...+profit( trade n ) , where n is the total number of profitable trades.
4.) Gross Loss (pips) : The gross profit in pips is the total loss in pips incurred from the signals.
Gross Loss = Loss( trade 1) +...Loss(trade n) , where n is the total number of losing trades.
5.) NET PROFIT : The NET profit in pips is the total profit in pips generated from the signals after excluding the losses.
Net Profit = Gross Profit - Gross Loss
6.) Maximal Loss/DrawDown (pips) : The maximal loss is the highest loss incurred on a single trade during the history of testing.
7.) Counted Days : Total number of trading days counted given the current history tested. With this information along with the Net Profit, traders can calculate their average daily profit.
HOW TO USE
We have designed this indicator to be as much as possible very easy to use by even a Novice Trader.
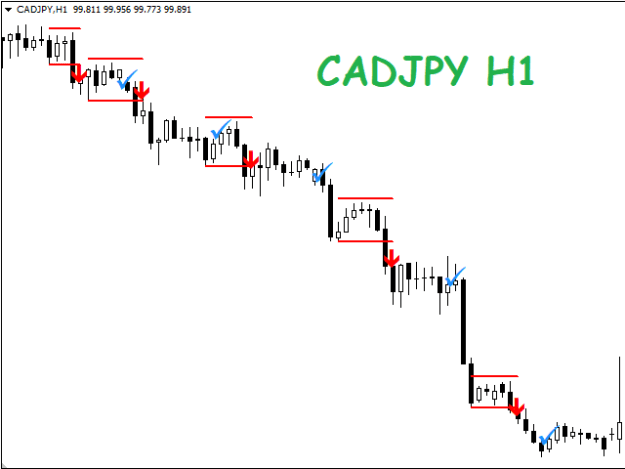
1.) The indicator can virtually be used with any pair/symbol and time frame
2.) Simply use the statistics dashboard to know the best pair and time frame to trade , the best pair and time frame is signed by high accuracy and high net profit.
3.) Simply change the settings to increase accuracy and watch the dashboard as you do so to get the best setting for the pair and time frame you want to trade.
4.) Set your stop loss and take profit to the indicator stop loss and take profit.
5.) Exit your trade when the check mark appears.
FREE VERSION
This Free version attached here works for GBPJPY, H1 time frame
Download Here >
Full version Link 1 > www.mql5.com/en/market/product/94017
Full version Link 2 > www.forexrobotmakers.com