Stupidly Easy Trading - Trading Blog
!!!!!!!!!! UPDATE !!!!!!!!!!!!
So to all of those who might have read the original post here, I have come to a conclusion and finally understood what am I actually seeing and wanted to share this with you. Basically the Title is the same STUPIDLY EASY! And I am putting all my efforts not to call it this system as that.
Let me put things right and ask you to SKIP!! all posts until Post #15 - and based on what you read HERE! check those pictures as well and you will see what I mean.
So BASIC! rules which applies to every where and these basic rules will be our main guides.
An UP-Trend is always followed by? A Down trend right? And Vicaüversa. Down-Trend is followed by an Up-Trend.
Now here comes the most important Fact we will EVER! need. A trend alawys breaks.
In my opinion, most people fail to understand when and how a trend can be drawn. I believe, when I draw a trend line, that trend line must cover everything. Which means, it always goes on the wicks, and always have only! 2 points.
Let me show you clean and not too clean examples.
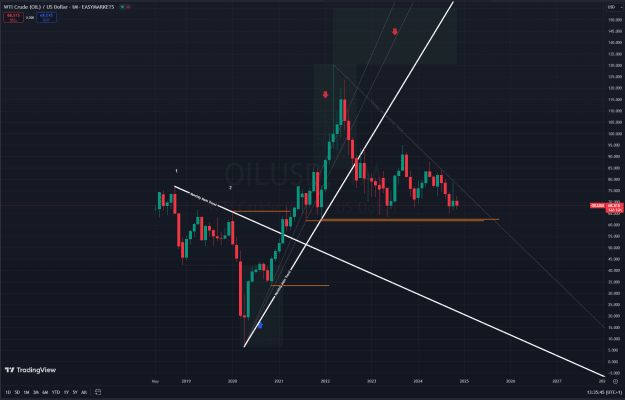
If you check the EURUSD Monthly chart, this is the actual picture that everyone should see:

The trend has a starter point and a 2nd point which are interconnected and it covers everything inbetween and it has ben extended towards the future.
Now what is not visible at first is how we got here. I will show you how this trend has evolved over time!

So in this picture you can see that the very first trend line was drawn as shown, which trendline got broken, and then the trend continued to make a new low, then the second trend got broken and continued down forming the third current Monthly main trend.
Now forming any of the new trend lines can be concluded only! if the previous trend's all time high or low depends on the trend gets broken. Here the green lines mark the spot.
Now comes the question, how come that a trend contionued, where as the actual trend line was broken? And also the question comes, how can we trade this??
Let me show you my understanding on how this can be traded easily.
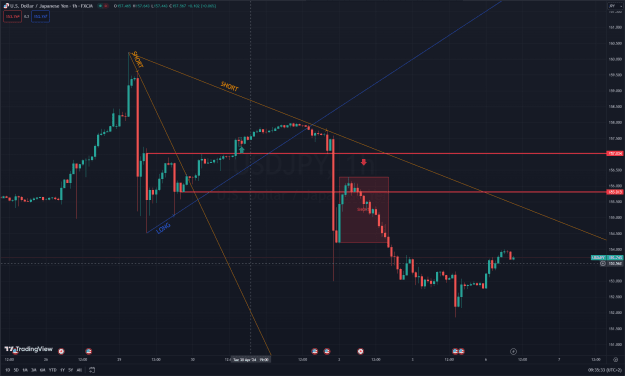
A full trend break would happen ONLY! if the 2nd leg's price geats broken. Failing to do so, the trend will continue making newer lows or highs.

On this image, you can see that the Orange lines were not broken, at all. So our best guess was when it started to come down, is that if it forms a new low, we know where the price will be going right? Towards the previous green line. Anywhere below that green line, is a good chance to aim for a trend line break. Which means, that the trend full filled its main purpose and validated it self by creating a new low, so from there, the next thing to happen is to get it break. Hence we are aiming for our trend line. We might not get to the orange levels, but we also know, that the trend line won't just be touched, but must be crossed. So Good profit can be made on this guess, and the best is, we can actually automate this.
Leave a pending order in the green zone, set an alarm for the trend line break, and you can forget the pair for good.
Now What you see is a really interesting scenario.
Our current main trend has been validated and made a new low, so the next step is to break the trend line. We had a strong bump off, but eventually that is the goal.
Our first goal is to have the the price above the trend line and get some profit. Now the only place for entry has been passed, any where this close is a bit too risky reward ration wise, so I don't recommend it as a long term investment.
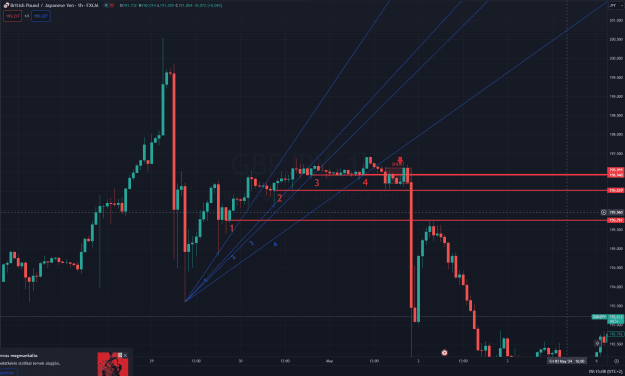
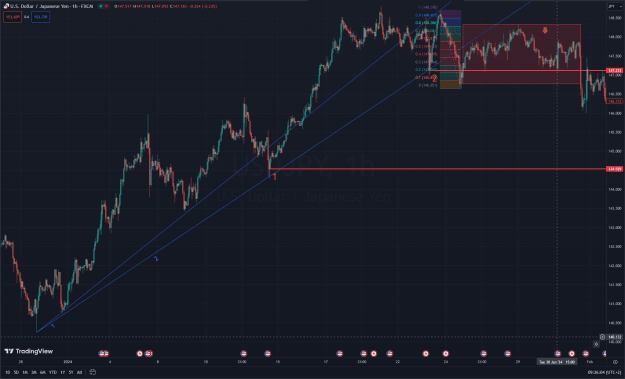
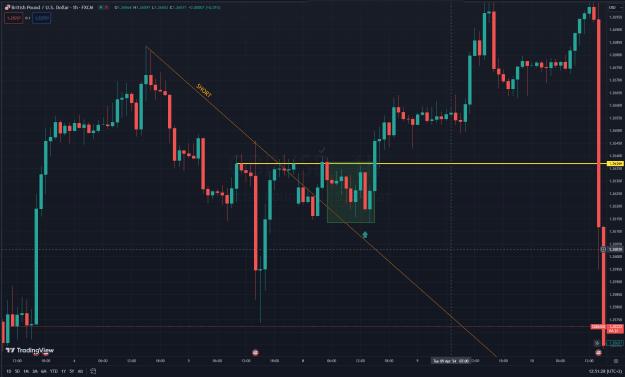
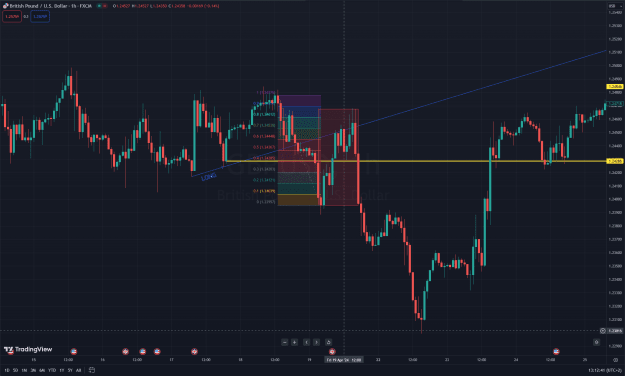
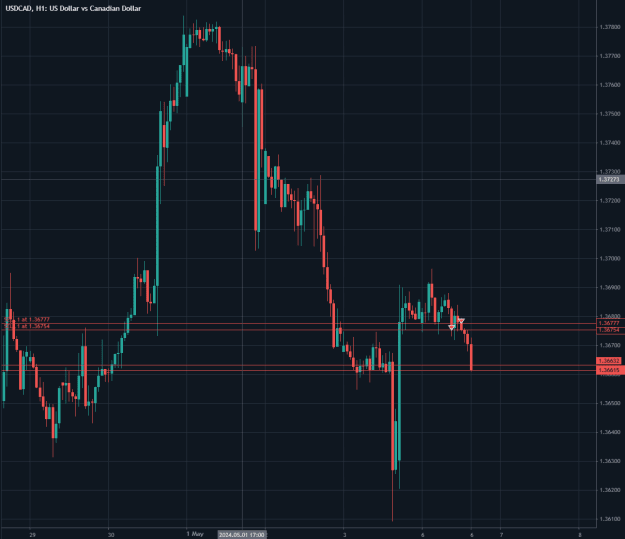
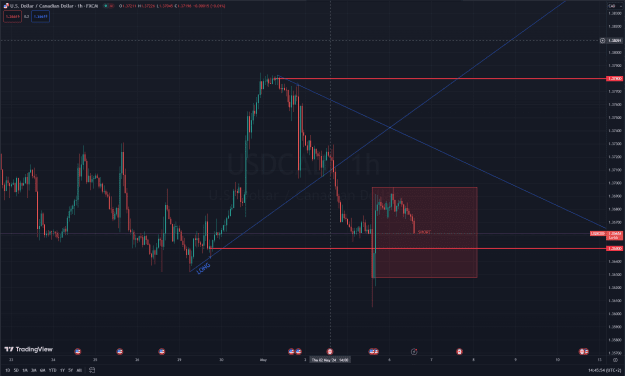
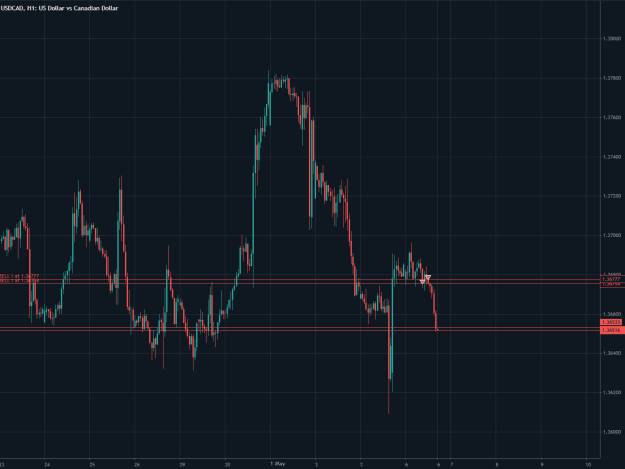
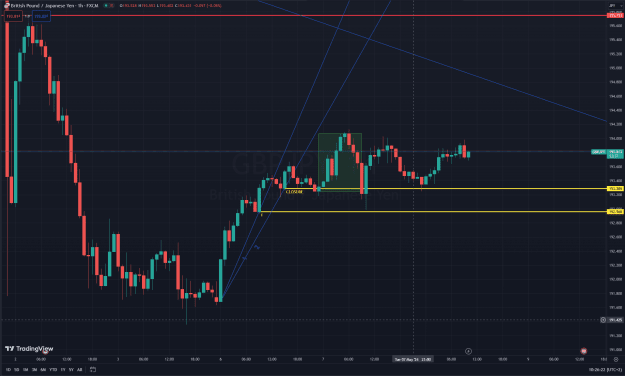
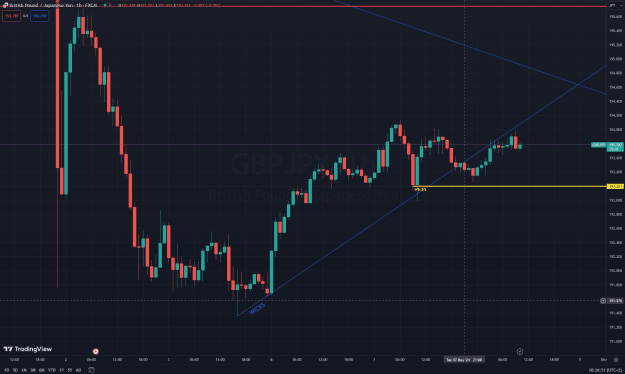
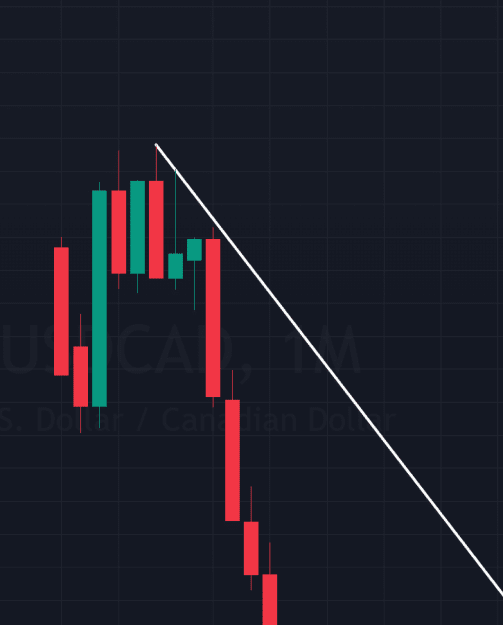
Now this is a monthly chart, but this setup works on every time frame and every stock, forex,crypto chart. I will share some examples.
Using the same colours, should give you an explanation on what I am seeing and how thes can be traded.
Please continue on Post 15!!!
AND AS ALWAYS - YOU TRADE ON YOUR OWN RISK
!!!!!!!!!! UPDATE !!!!!!!!!!!!
So to all of those who might have read the original post here, I have come to a conclusion and finally understood what am I actually seeing and wanted to share this with you. Basically the Title is the same STUPIDLY EASY! And I am putting all my efforts not to call it this system as that.
Let me put things right and ask you to SKIP!! all posts until Post #15 - and based on what you read HERE! check those pictures as well and you will see what I mean.
So BASIC! rules which applies to every where and these basic rules will be our main guides.
An UP-Trend is always followed by? A Down trend right? And Vicaüversa. Down-Trend is followed by an Up-Trend.
Now here comes the most important Fact we will EVER! need. A trend alawys breaks.
In my opinion, most people fail to understand when and how a trend can be drawn. I believe, when I draw a trend line, that trend line must cover everything. Which means, it always goes on the wicks, and always have only! 2 points.
Let me show you clean and not too clean examples.
If you check the EURUSD Monthly chart, this is the actual picture that everyone should see:
Attached Image (click to enlarge)
The trend has a starter point and a 2nd point which are interconnected and it covers everything inbetween and it has ben extended towards the future.
Now what is not visible at first is how we got here. I will show you how this trend has evolved over time!
Attached Image (click to enlarge)
So in this picture you can see that the very first trend line was drawn as shown, which trendline got broken, and then the trend continued to make a new low, then the second trend got broken and continued down forming the third current Monthly main trend.
Now forming any of the new trend lines can be concluded only! if the previous trend's all time high or low depends on the trend gets broken. Here the green lines mark the spot.
Now comes the question, how come that a trend contionued, where as the actual trend line was broken? And also the question comes, how can we trade this??
Let me show you my understanding on how this can be traded easily.
A full trend break would happen ONLY! if the 2nd leg's price geats broken. Failing to do so, the trend will continue making newer lows or highs.
Attached Image (click to enlarge)
On this image, you can see that the Orange lines were not broken, at all. So our best guess was when it started to come down, is that if it forms a new low, we know where the price will be going right? Towards the previous green line. Anywhere below that green line, is a good chance to aim for a trend line break. Which means, that the trend full filled its main purpose and validated it self by creating a new low, so from there, the next thing to happen is to get it break. Hence we are aiming for our trend line. We might not get to the orange levels, but we also know, that the trend line won't just be touched, but must be crossed. So Good profit can be made on this guess, and the best is, we can actually automate this.
Leave a pending order in the green zone, set an alarm for the trend line break, and you can forget the pair for good.
Now What you see is a really interesting scenario.
Our current main trend has been validated and made a new low, so the next step is to break the trend line. We had a strong bump off, but eventually that is the goal.
Our first goal is to have the the price above the trend line and get some profit. Now the only place for entry has been passed, any where this close is a bit too risky reward ration wise, so I don't recommend it as a long term investment.
Now this is a monthly chart, but this setup works on every time frame and every stock, forex,crypto chart. I will share some examples.
Using the same colours, should give you an explanation on what I am seeing and how thes can be traded.
Please continue on Post 15!!!
AND AS ALWAYS - YOU TRADE ON YOUR OWN RISK