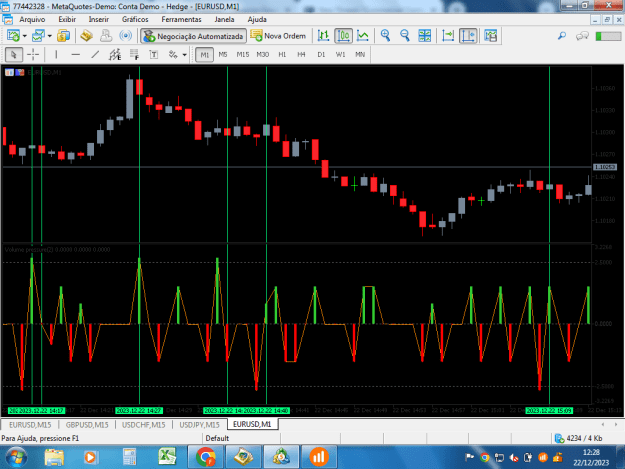
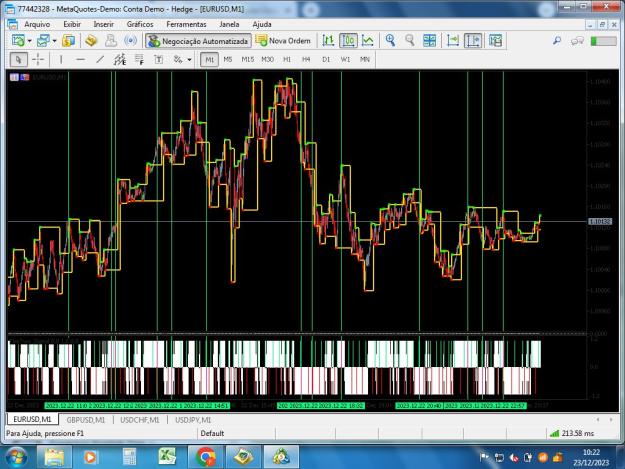
We know that the volume of ticks does not always reflect the reality of the market, which is why I decided to create the indicator that, in addition to counting the number of ticks in each region of the candle, also traces a volume profile seeking the 70% area of greatest liquidity.
This way, whenever there is a lack of supply or demand when reaching certain volume levels, we will have an overbought or oversold in the indicator beyond the 2.50 and - 2.50 levels.
This way we know that the price is being traded in discount regions and interest has decreased, leading the market to a possible reaction.
Some experts don't think this is such an interesting approach, but it has made me earn good money daily due to its huge number of consecutive wins.
Are you interested in the indicator?
Contact me via telegram or whatsap.
Attached Image(s) (click to enlarge)