Hi good day all.
I am creating this thread for Traders and coders.
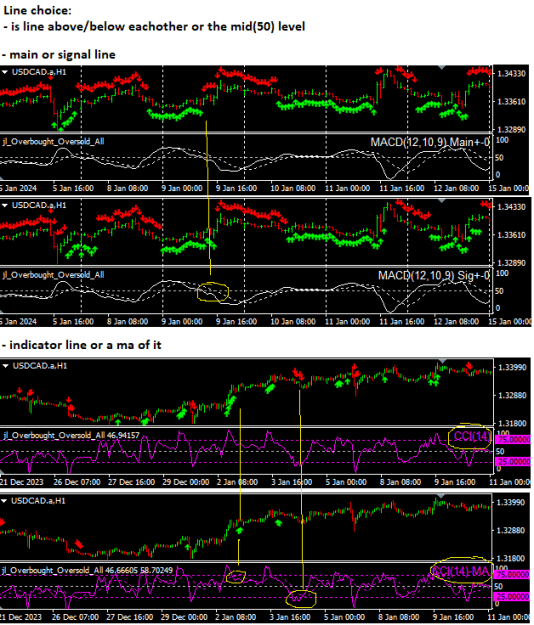
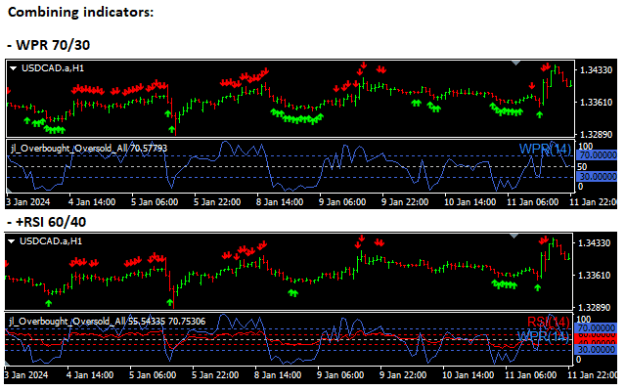
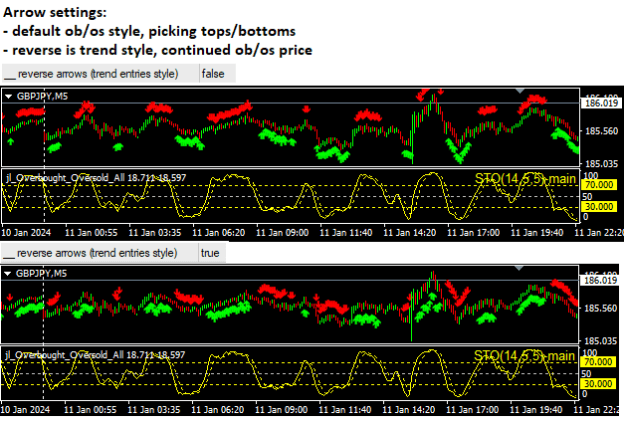
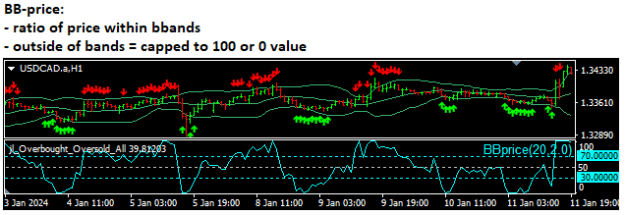
Aim is to develop a oversold and overbought indicator that print a up and down arrow on the chart .
Aim is to combine a bunch of indicators to generate one overbought and oversold signal .
Indicators
1) RSI indicator 70 and 30 level
2) Stochastic Indicator 20 and 80 level
3) Williams percentage indicator -80 and -20 level
4) MFI indicator 80 and 20
5) bollinger band upper and lower bands.
When all indicators oversold up arrow
When all indicators overbought down arrow .
Trading strategy.
H1 timeframe
13ema and 100 ema cross up
Macd above zero level
Williams percentage indicator above -50 level
Stochastic Indicator below 50 level .
M15 timeframe 50ema cross above 200ema
M15 and lower timeframe issue oversold up arrow Buy trade.
I am creating this thread for Traders and coders.
Aim is to develop a oversold and overbought indicator that print a up and down arrow on the chart .
Aim is to combine a bunch of indicators to generate one overbought and oversold signal .
Indicators
1) RSI indicator 70 and 30 level
2) Stochastic Indicator 20 and 80 level
3) Williams percentage indicator -80 and -20 level
4) MFI indicator 80 and 20
5) bollinger band upper and lower bands.
When all indicators oversold up arrow
When all indicators overbought down arrow .
Trading strategy.
H1 timeframe
13ema and 100 ema cross up
Macd above zero level
Williams percentage indicator above -50 level
Stochastic Indicator below 50 level .
M15 timeframe 50ema cross above 200ema
M15 and lower timeframe issue oversold up arrow Buy trade.