Good day, Forex Factory!
Inspired by another thread, I think posting it regularly over a strategy keeps us accountable, and more discipline to follow a strategy, over and over again.
Either using this as a journal or as a forward test medium, I would start to post regularly over here.
Ideas Credit:
I follow someone called @chrisdmacro on X (or Twitter LOL - his profile) - he's a funded prop trader and trading coach by offers his services on Pollinate Trading.
He shares one of his strategies that I will help to explain below called Failed Volatility Breakout (so-called FVBO) and Volatility Breakout (VBO) - will added later.
This strategy takes advantage of the moment when the market is squeezing in a "low volatility" period.
After that, it does wild movement after it expands back to the "higher volatility" period, in another term: The Breakout.
And after the breakout, we can see two possibilities. One the price will go straight to create a new trend (either uptrend or downtrend) - we try to catch this move by Volatility Breakout Strategy (VBO).
Or two, the price will snap back into the Bollinger Bands since we believe that the ranging market is happening more than the trending market. We try to catch this mean-reverting characteristic by using the Failed Volatility Breakout Strategy (FVBO).
The Setup for FVBO:
Open a chart and add: Keltner Channels (20, 1.5) + Bollinger Bands (20, 2)
When the Bollinger Bands are inside the Keltner Channels This is considered low volatility.
The Setup is when Bollinger Bands are inside the Keltner and a candle closes outside the Bollinger and Keltner channel.
Then the next candle is the Signal candle if it is an inside candle (the body of the candle is contained within the previous candle) wait for the candle to close.
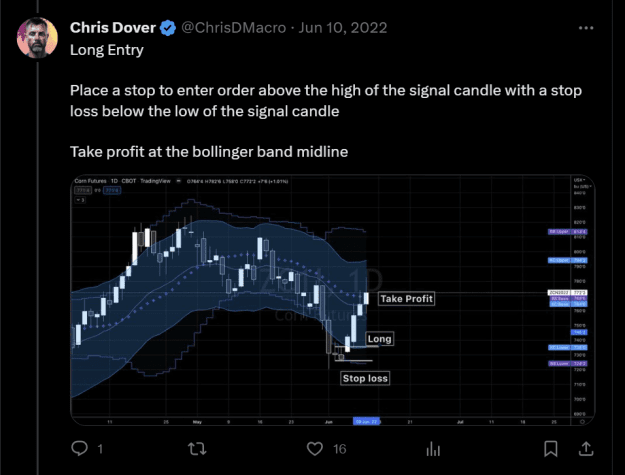
Long Entry FVBO:
Place a stop to enter order above the high of the signal candle with a stop loss below the low of the signal candle.
TP at the midline of Bollinger Bands.
--
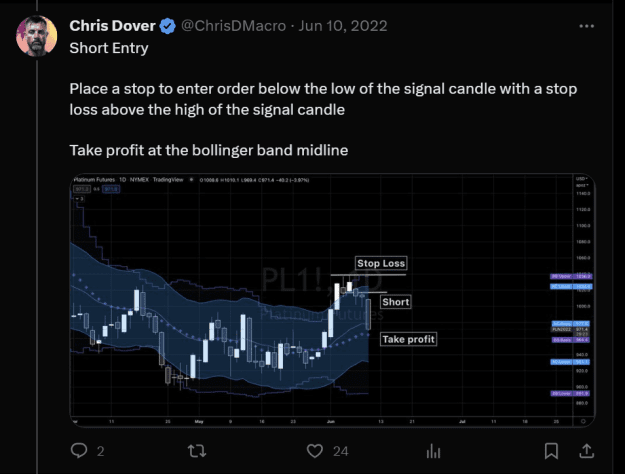
Short Entry FVBO:
Place a stop to enter order below the low of the signal candle with a stop loss above the high of the signal candle.
Again, TP is at the midline of Bollinger Bands.
It is the original setup. For today I'm finished here!
https://pbs.twimg.com/media/FWSJr6pU...pg&name=medium
But please subscribe to see more development of the threads:
1. Volatility Breakout (VBO) Strategy
2. More sample cases of FVBO and VBO Strategy.
3. Some of the backtesting data I've collected.
4. Gold: I code a special indicator to help me see both strategies in one indicator.
5. Live action of the current market trading this strategy.
Discussion is very welcome, please keep in a good manner and respect.
Discussion of this thread is for these two strategies only.
Inspired by another thread, I think posting it regularly over a strategy keeps us accountable, and more discipline to follow a strategy, over and over again.
Either using this as a journal or as a forward test medium, I would start to post regularly over here.
Ideas Credit:
I follow someone called @chrisdmacro on X (or Twitter LOL - his profile) - he's a funded prop trader and trading coach by offers his services on Pollinate Trading.
He shares one of his strategies that I will help to explain below called Failed Volatility Breakout (so-called FVBO) and Volatility Breakout (VBO) - will added later.
Attached Image (click to enlarge)
This strategy takes advantage of the moment when the market is squeezing in a "low volatility" period.
After that, it does wild movement after it expands back to the "higher volatility" period, in another term: The Breakout.
And after the breakout, we can see two possibilities. One the price will go straight to create a new trend (either uptrend or downtrend) - we try to catch this move by Volatility Breakout Strategy (VBO).
Or two, the price will snap back into the Bollinger Bands since we believe that the ranging market is happening more than the trending market. We try to catch this mean-reverting characteristic by using the Failed Volatility Breakout Strategy (FVBO).
The Setup for FVBO:
Open a chart and add: Keltner Channels (20, 1.5) + Bollinger Bands (20, 2)
When the Bollinger Bands are inside the Keltner Channels This is considered low volatility.
The Setup is when Bollinger Bands are inside the Keltner and a candle closes outside the Bollinger and Keltner channel.
Then the next candle is the Signal candle if it is an inside candle (the body of the candle is contained within the previous candle) wait for the candle to close.
Long Entry FVBO:
Place a stop to enter order above the high of the signal candle with a stop loss below the low of the signal candle.
TP at the midline of Bollinger Bands.
Attached Image (click to enlarge)
--
Short Entry FVBO:
Place a stop to enter order below the low of the signal candle with a stop loss above the high of the signal candle.
Again, TP is at the midline of Bollinger Bands.
Attached Image (click to enlarge)
It is the original setup. For today I'm finished here!
https://pbs.twimg.com/media/FWSJr6pU...pg&name=medium
Chris' backtest data (from his Twitter)
But please subscribe to see more development of the threads:
1. Volatility Breakout (VBO) Strategy
2. More sample cases of FVBO and VBO Strategy.
3. Some of the backtesting data I've collected.
4. Gold: I code a special indicator to help me see both strategies in one indicator.
5. Live action of the current market trading this strategy.
Discussion is very welcome, please keep in a good manner and respect.
Discussion of this thread is for these two strategies only.
Yes, Jakarta is in Indonesia.