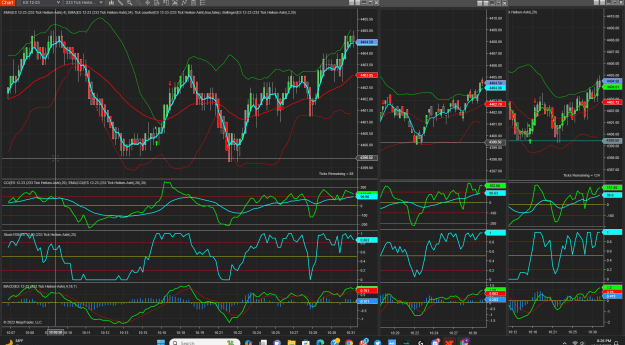
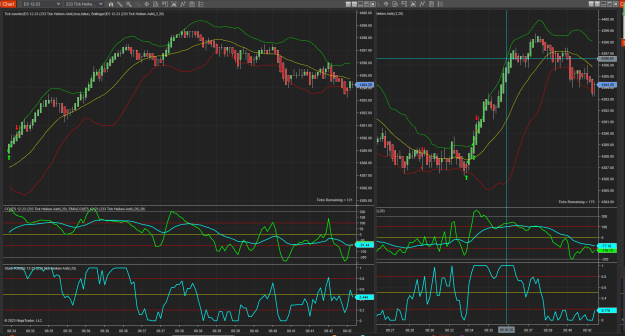
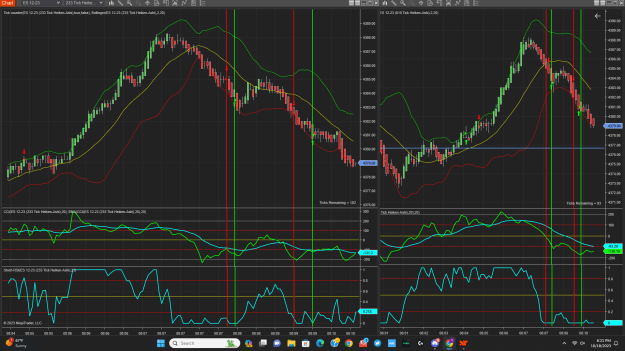
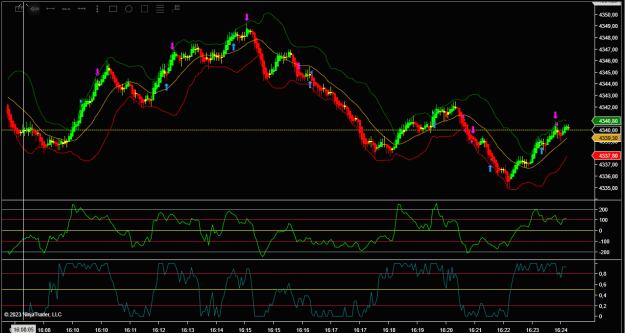
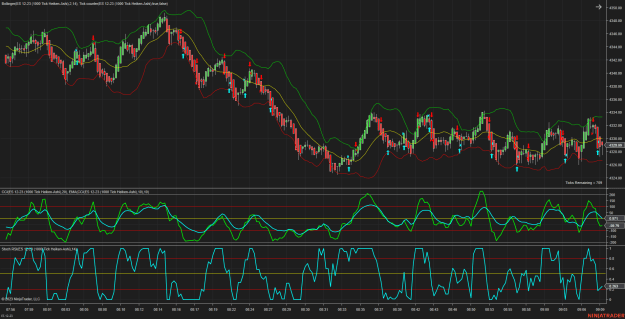
Anything in this thread is useful in any market. Markets are markets are markets and it just depends on how you want to trade.
I started trading in 1995. I love it! I am always trying to learn new things even now; because markets change. Then market trades totally different today than it did 25 years ago. And it will continue to evolve.
I trade using Multiple time frames. I use mostly tick charts and I trade mostly the ES and Micro ES (E-Mini contracts). They are cheaper to trade. have very narrow spread's. The brokers are regulated so you get better fills and less slippage.
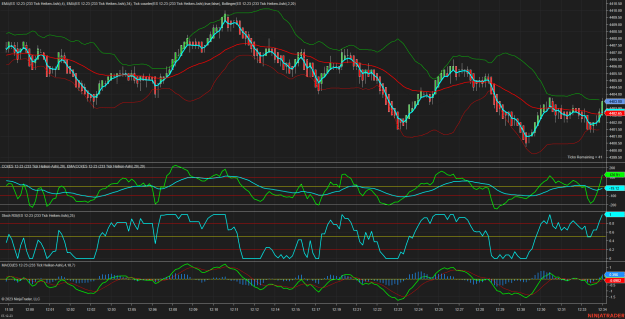
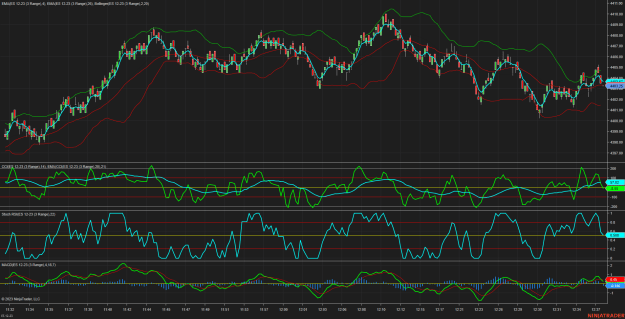
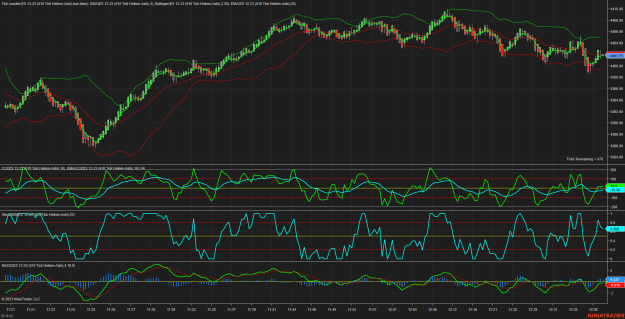
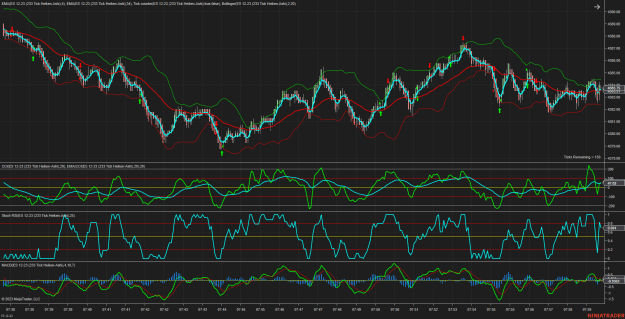
My Anchor chart is between 600-900 ticks. And my entry chart is between 150-300 ticks. I use the CCI, Stoch-RSI, MACD, Williams% R, Bollinger Bands. These are all possibilities on my charts. The process is pretty simple. Trade in the direction of the Anchor chart and make your actual entries on the entry chart. So what that means is that if I am looking at the 610 tick chart, watching the CCI and I see it is breaking below the zero line, Then I will look at the 233 tick chart and if the CCI is below or breaking below the zero line then I would probably take the trade. If it doing the opposite then I would probably go long. The CCI on the long term and short term have to be in agreement. The same goes for the Sto-RSI.
I like to keep things pretty simple, if it gets to complicated then usually it costs me money.

