PLEASE READ
Please watch this MULTIPLE times!
https://www.youtube.com/watch?v=oeoz94F2yJs&ab_channel=TradingNut
Please watch this MULTIPLE times!
This video (https://www.youtube.com/watch?v=oeoz94F2yJs&ab_channel=TradingNut) discusses a 1:3 ICT trading strategy that allows traders to trade while holding a full-time job. The strategy involves analyzing a single four-hour candle each morning, setting up 15-minute alerts based on liquidity sweeps, and waiting for a breach before reacting to the market. Scott Taylor emphasizes the importance of keeping the strategy simple with only one entry model. The target is always three times the amount of risked capital, and traders should risk only 1% of their funded account. The dead zone between 10 AM and 1:30 PM UK time is observed, where trading is avoided.
This post will be constantly updated as we learn more and more about the system.
Let's breakdown exactly how a trade is constructed.
Timeframes:
| 4 Hour for directional bias
| 15 Minute for entry
Indicators:
| Fractal High and Lows
Attached File(s)
Attached File(s)
Killzones:
NY KillZone - 6:45 am to 9:45 (us east)
London KillZone - 1:45am to 4:45am (us east)
only trade during NY and London session
Setup:
| Draw horizontal lines from the most recent fractal high and most recent fractal low on the 4H chart.
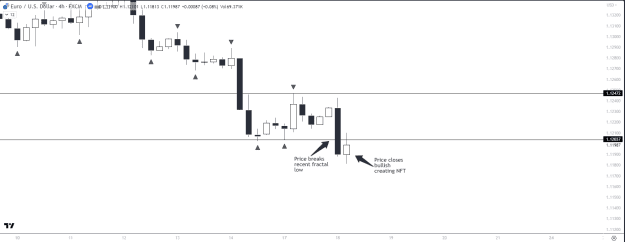
| Wait for price to breach one of these lines, as we wait for a NFT.
(NFT)Non Follow Through - This is when price either creates a wick that went through the fractal level, or one candle closed above the fractal level and the next candle closed below it. If two candles close above or below the fractal level then that creates a "follow through" and there's no trade. We're looking for areas on the 4H that price rejected.
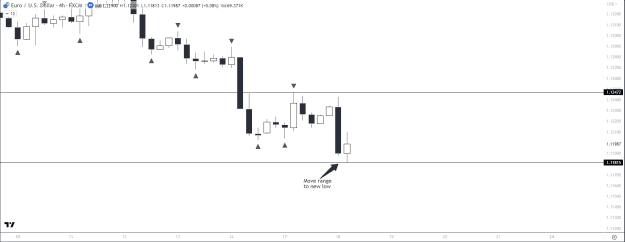
| Short Example - Once price has created a NFT, by either creating a wick that pierced above the recent fractal high, or closed above the level then immediately closed below..we can then MOVE OUR ZONE TO THE NEW HIGH.
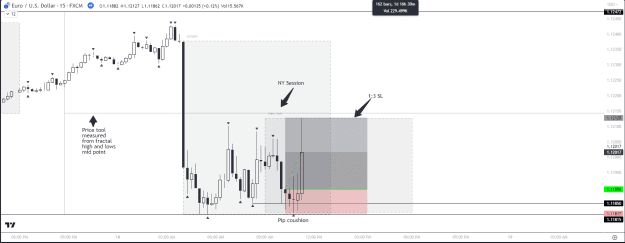
| Using your draw tool draw a range from the new high to the low fractal you had before. The middle of this range will be used to identify the Premium Zone (upper area) and the Discount Zone (lower area).
Entry Model:
| On the 15 Minute Time Frame you are now looking for SHORTS only in the Premium Zone. As soon as price goes into Discounted Zone, beyond the "EQ"(middle line), you're no longer looking for shorts (middle line). This creates a nice filter for only taking really high probability setups. If you're taking shorts down in the discounted area, you're more likely to become liquidity.
| ONLY During NY or London Killzones, you are waiting for a draw of liquidity on the 15M timeframe. When price sweeps a fractal high.
| Draw and horizontal from the most recent fractal high (IN NY or LON KZ) and wait for price to come back to it to grab liquidity.
| Set a stop order to at the low of the candle the broke horizontal line from the fractal for a short.
| Set you stops loss a pip or two above that same candle (trigger candle).
| Always target 1:3 - Even at a 33% win rate you're still profitable. (This WAY higher)
| You can continue to take trades from the 15M if the 4H fractal doesn't change.
*I will be updating this post and adding screen shots soon*