I have decided to post these photos for discussion and hopefully there will be more photos to evaluate the visual aspect of coding with the currencies.
Programming gives us the ability to see things represented in different ways, photos and pictures help us to understand information and look at situations, with new perspectives.
Everything you see in the photos were created by myself and/or are open source and available to everyone. Please do not ask 'where do i get this ' use the search on the forum and do some research. It's all here! And it will be created in your own way. How do you start? One step at a time.
Rgds.
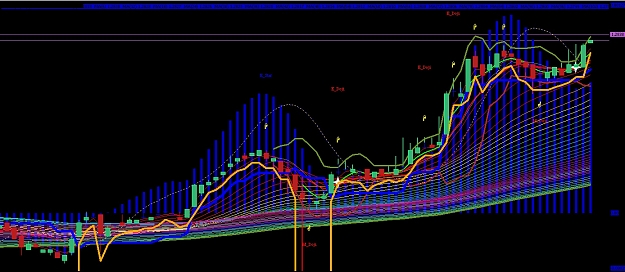
1. The first photo is of the EURUSD on a steady run, steaming along like a freight train! The orange ATR and histogram MACD emphasize additional support.
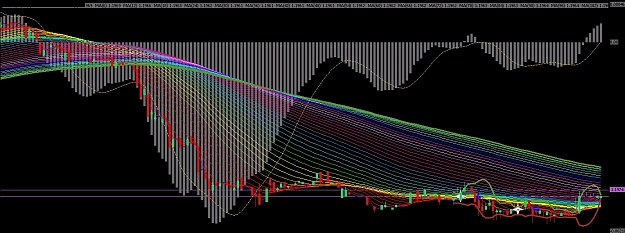
2. The second photo is USDCAD tired and bored ready to fall asleep. There's no life here yet. The ribbons hangs down low as the currency drags along the bottom. Notice the bollinger balloons.
Programming gives us the ability to see things represented in different ways, photos and pictures help us to understand information and look at situations, with new perspectives.
Everything you see in the photos were created by myself and/or are open source and available to everyone. Please do not ask 'where do i get this ' use the search on the forum and do some research. It's all here! And it will be created in your own way. How do you start? One step at a time.
Rgds.
1. The first photo is of the EURUSD on a steady run, steaming along like a freight train! The orange ATR and histogram MACD emphasize additional support.
2. The second photo is USDCAD tired and bored ready to fall asleep. There's no life here yet. The ribbons hangs down low as the currency drags along the bottom. Notice the bollinger balloons.
Attached Image(s) (click to enlarge)