• Home
  • Forums
  • Trades
  • News
  • Calendar
  • Market
  • Brokers
  • Login
  • Join
  • 11:17am
Menu
  • Forums
  • Trades
  • News
  • Calendar
  • Market
  • Brokers
  • Login
  • Join
  • 11:17am
Sister Sites
  • Metals Mine
  • Energy EXCH
  • Crypto Craft

Options

Bookmark Thread

First Page First Unread Last Page Last Post

Print Thread

Similar Threads

RSI cross indicator when rsi=50 19 replies

RSI (Fast) above/below RSI (Slow) displayed as a Histogram 5 replies

PJ over RSI---Needs Alert 0 replies

Improved Rsi Needs Code 1 reply

RSI, MA, BOLL or RSI, BOLL MA diferents results 2 replies

  • Platform Tech
  • /
  • Reply to Thread
  • Subscribe
  • 3
Attachments: Improved Rsi Needs Code
Exit Attachments
Tags: Improved Rsi Needs Code
Cancel

Improved Rsi Needs Code

  • Post #1
  • Quote
  • First Post: Jan 7, 2007 5:19pm Jan 7, 2007 5:19pm
  •  bobbyacim
  • | Joined Sep 2004 | Status: Member | 3 Posts
Dear Fellow traders,
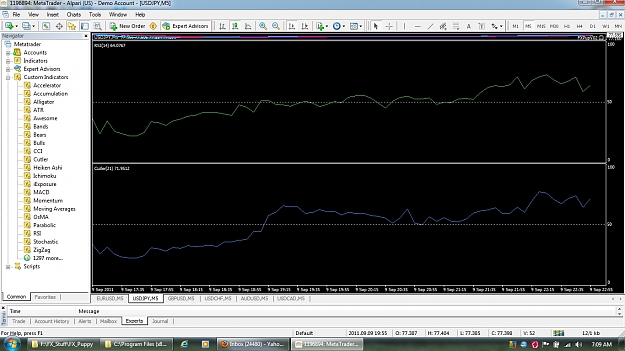
I am new to this site; been experimenting for over a year with different indicators on a demo account. Found something called Cutler's RSI, comparing it with Wilder's Original indicator, this modified version appears more robust apparently because Wilder's RSI is calculated by determining the difference between the open and the close; Cutler's RSI is calculated by determining the difference between the previous bar's close and the current close (the net change!).

Can anyone help me code it in MT4?

THANKS,
ROB
[email protected]

http://www.aspenres.com/Documents/As...CutlersRSI.htm
CutlersRSI(SERIES, Periods=14, Bate=6)=begin

SumUp = 0
SumDown = 0
RS = 1
currentPrice = NONUM
previousPrice = NONUM
difference = 0
for i = -1 to (Periods - 2) begin
currentPrice = GetPrice($1, Bate, i, Periods)
previousPrice = GetPrice($1, Bate, (i + 1), Periods)
difference = currentPrice - previousPrice
if difference > 0 then SumUp = SumUp + difference
if difference < 0 then SumDown = SumDown + abs(difference)
end
if SumDown > 0 then RS = SumUp / SumDown
retval = GetRS(RS)
retval
end


<TABLE class=whs1 cellSpacing=0 width="100%" x-use-null-cells><TBODY><TR class=whs3 vAlign=top><TD class=whs12 width="20.67%">Parameters


</TD><TD class=whs13 width="79.32%">SERIES


The SERIES directive makes this formula available as a Formula Study. SERIES refers to the instrument in a chart. SERIES does not become a study parameter.

Periods

The number of periods, or length, of the RSI. The default is 14.

Bate

The Bate parameter determines what price (open, high, low, last, bid, ask, etc.) is used in calculating. The default is 6, or BATE_CLOSE.


</TD></TR><TR class=whs3 vAlign=top><TD class=whs12 width="20.67%">


</TD><TD class=whs13 width="79.32%">


</TD></TR><TR class=whs3 vAlign=top><TD class=whs12 width="20.67%">Return Value


</TD><TD class=whs13 width="79.32%">Cutler's RSI


</TD></TR></TBODY></TABLE>
  • Post #2
  • Quote
  • Jul 23, 2009 7:48am Jul 23, 2009 7:48am
  •  Alex K
  • | Joined Aug 2008 | Status: Member | 16 Posts
Has anyone coded it into metatrader 4 format yet?
 
 
  • Post #3
  • Quote
  • Jul 25, 2009 6:06am Jul 25, 2009 6:06am
  •  hanover
  • Joined Sep 2006 | Status: ... | 8,095 Posts
Quoting bobbyacim
Disliked
......Wilder's RSI is calculated by determining the difference between the open and the close; Cutler's RSI is calculated by determining the difference between the previous bar's close and the current close (the net change!).
Ignored
My understanding is that Wilder's RSI is based around dividing a smoothed average of the gains by a smoothed average of the losses. The gains and losses are obtained by finding the difference between relevant closes, not the open and close. (For example, see points 2, 3 and 4 in the "Formula" section here):

2. Compare Closing price [today] to Closing price [yesterday].
3. For the RSI Period, add all upward movements in Closing price.
4. For the RSI Period, add all downward movements in Closing price.


Incidentally, MT4's RSI indicator allows the RSI to be applied to any number of values: successive Closes, Opens, Highs, Lows, Median Price, Typical Price, etc.

In any case, except for gaps across the weekend, forex is a continuous 24-hour market, hence the open of one candle is generally equal to the close of its predecessor.
 
 
  • Post #4
  • Quote
  • Aug 25, 2011 9:00am Aug 25, 2011 9:00am
  •  r4bb1t
  • | Joined Jan 2010 | Status: Member | 27 Posts
Quoting hanover
Disliked
My understanding is that Wilder's RSI is based around dividing a smoothed average of the gains by a smoothed average of the losses. The gains and losses are obtained by finding the difference between relevant closes, not the open and close.
Ignored
i agree with hanover.
the only difference between Wilder's rsi and Cutler's rsi is.
Wilder used ema for smoothing and Cutler used sma for smoothing.
i think the formula is some different thing. either not Wilder or Cutler

http://en.wikipedia.org/wiki/Relativ...Cutler.27s_RSI
 
 
  • Post #5
  • Quote
  • Sep 11, 2011 12:08pm Sep 11, 2011 12:08pm
  •  andydcoles
  • | Joined Sep 2011 | Status: Junior Member | 2 Posts
Further to the helpful posts from hanover and r4bb1t, I have modified Metaquotes' original "RSI.mq4" source file to perform Cutler's RSI.

Using the default RSI Period of 14, RSI and Cutler's RSI period of 21, two graphs are compared.

One of the features of MT4's implementation of Wilder's RSI is the history it includes. With the default period of 14 Bars, the next Bar's result is 13/14 times the previous Bars result, plus 1/14 of the latest Bar's Closure result. Metaquotes appear to start computation before the first displayed Chart Bar. Thus some argument could be made that the gradient of the line produced for RSI has significance as well as the level, due to the in-built history.

Cutler's RSI is quite different, in that it only uses the Close differences for the specified number of Bars. No prior history is built in. The absolute values may be more accurate than Wilder's, strictly only reflecting Rate movement during the specified number of Bars, just averaged.

For anyone interested in trying Cutler's RSI, please copy "Cutler.mq4" into your 'experts/indicators' folder. It will then appear under Custom Indicators when you next open MT4.

There are no guarantees that I have correctly indexed the additional "Behind" arrays (a sliding window is used for efficiency). You may be getting what you paid for!
Attached Image (click to enlarge)
Click to Enlarge

Name: Cutler.jpg
Size: 321 KB
Attached File(s)
File Type: mq4 Cutler.mq4   3 KB | 445 downloads
 
 
  • Post #6
  • Quote
  • Last Post: Nov 13, 2011 10:29am Nov 13, 2011 10:29am
  •  andydcoles
  • | Joined Sep 2011 | Status: Junior Member | 2 Posts
There was an array indexing error (by one) in the previous Cutler.mq4 file posted.

The corrected source (CutlerRSI.mq4) was verified against a DLL version of the same Indicator. The latter was calculated differently (just for the last specified Candle, no array storage), tested in an Expert Advisor with display of the MT4 CutlerRSI Indicator attached.
Attached File(s)
File Type: mq4 CutlerRSI.mq4   4 KB | 776 downloads
 
 
  • Platform Tech
  • /
  • Improved Rsi Needs Code
  • Reply to Thread
0 traders viewing now
Top of Page
  • Facebook
  • Twitter
About FF
  • Mission
  • Products
  • User Guide
  • Media Kit
  • Blog
  • Contact
FF Products
  • Forums
  • Trades
  • Calendar
  • News
  • Market
  • Brokers
  • Trade Explorer
FF Website
  • Homepage
  • Search
  • Members
  • Report a Bug
Follow FF
  • Facebook
  • Twitter

FF Sister Sites:

  • Metals Mine
  • Energy EXCH
  • Crypto Craft

Forex Factory® is a brand of Fair Economy, Inc.

Terms of Service / ©2023