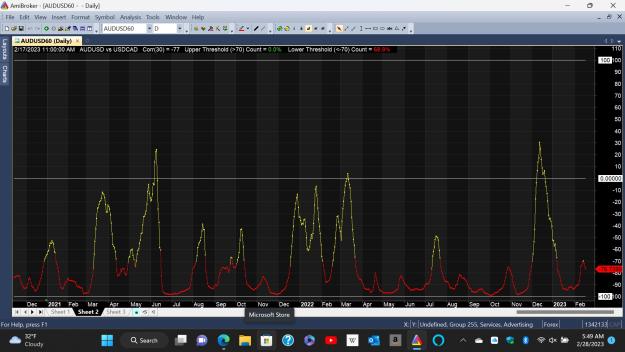
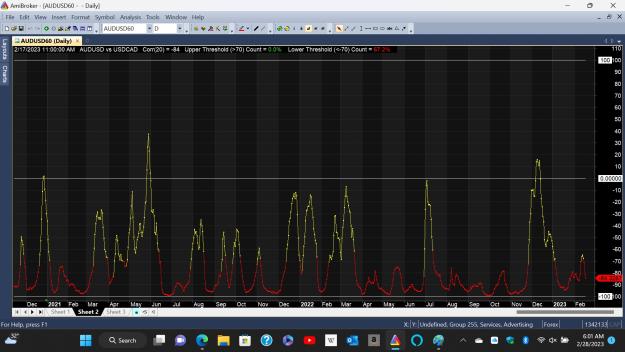
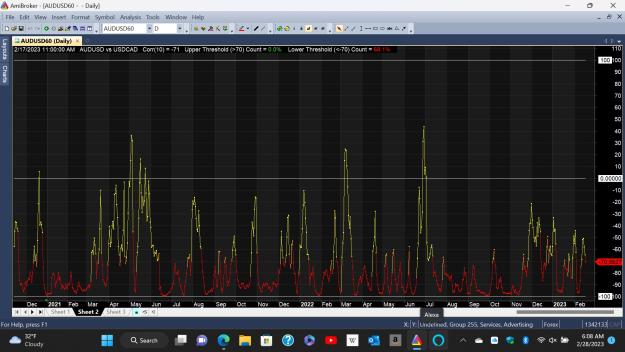
Disliked{quote} Z-score relates to the degree of deviation of a dependent variable from its mean assuming a normal distribution of the dependent variable, but since price versus time is not normally distributed (due to kurtosis), a Z-score is not appropriate - but I have to defer to the hard-core stats folks. You're right regarding Amibroker, and I wrote this Correlation Plot to let me quantify the number of bars above/below a certain threshold (I generally use +/- 70 over a 100-bar period) as well as visualize the correlation over several years of data....Ignored
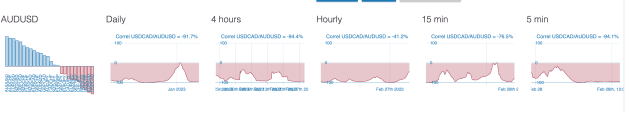
what I have heard is that yes they monitor STD 2, 3, 4 and they average there...
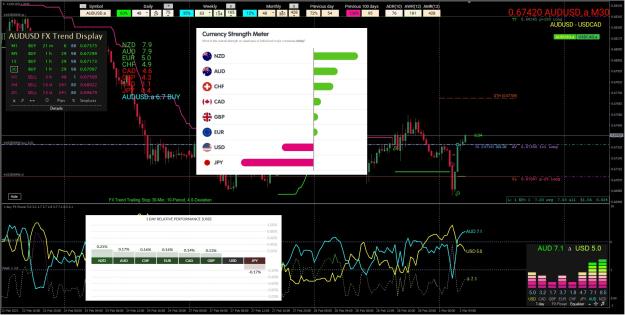
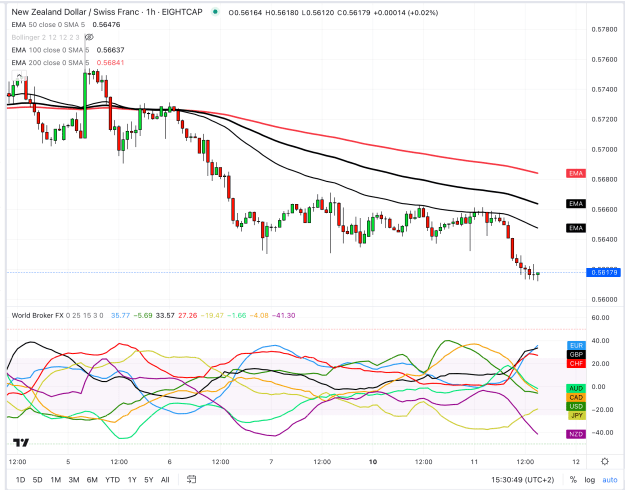
at the end is like a bollinger band, if you average but you are against the trend end badly. That amibroker chart it's perfect, is cyclical
Anyone knows a MT5 or MT4 indicator that can do the same chart of amibroker? it is really helpful I think
in holiday till end of November