17-12-2023 My fellow forex trader friends.
I have to make a hard decision now. All those years, up's and down's. I really tried my best to make this strategy work, but I failed to prove profitability. Therefore be very careful trading using methods described in this and my earlier threads. I'm sorry I failed you. Throwing in the towel for now, but once I regain strength I will continue pursuing the financial trading dream. Wishes my brothers on FF will make it one day. Giving up was never an option for me, but I do not wish to promote something here not profitable. All our times are too valuable for that, just know I did all with the best intentions.
Farewell for now, I will take a break on FF and only return if I come closer to the Holy Grail. Been depressed lately and my apologies for not answering threads and private messages. I struggle with my mood and unemployment, can't even afford Christmas gifts. Thanks everyone for the loyal support here throughout the years and best of luck in your future endeavors.
Best regards, yours Lekkim <3
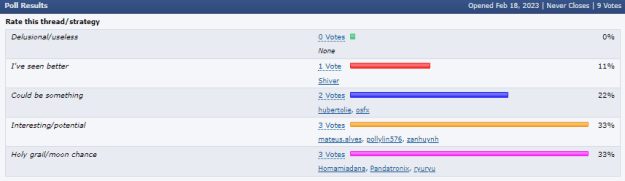
Attached Image(s) (click to enlarge)


Attached File(s)