hope they explain it a bit
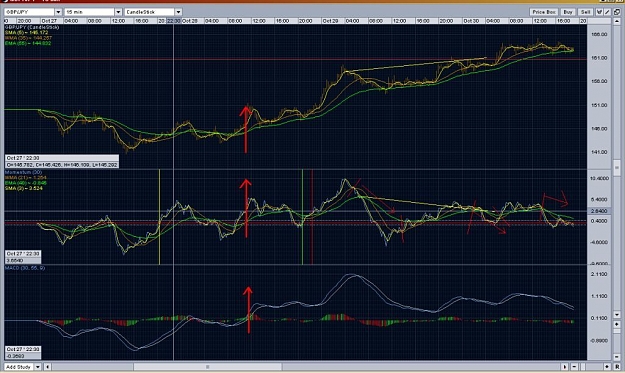
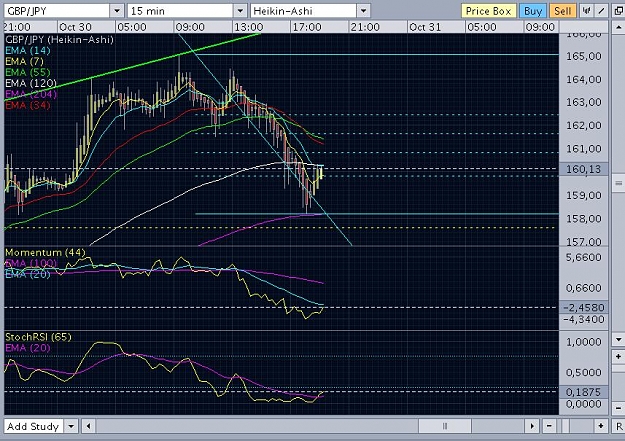
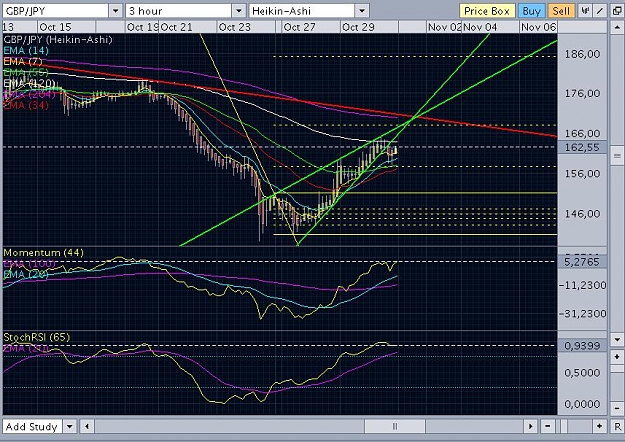
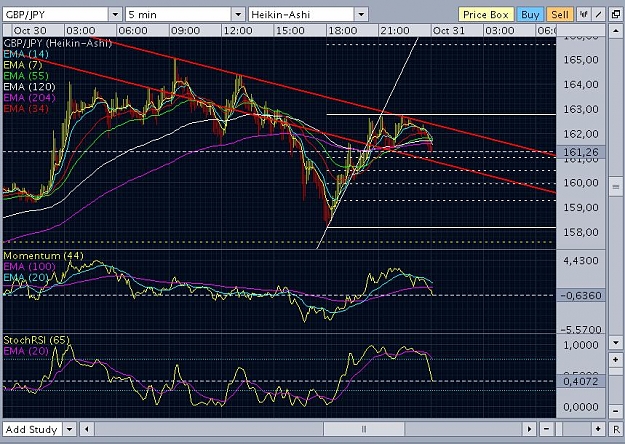
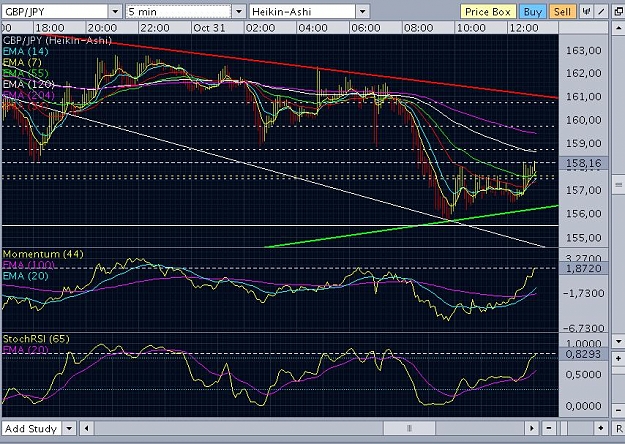
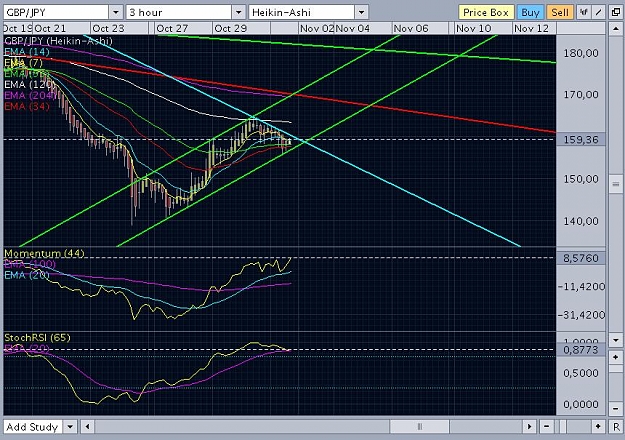
in the first image the mom30 above zero line corresponds exactly with the cross over of the MAs of MACD30
For me it is like this -----> when the (yellow) sma3 crosses down brown wma21 it is a correction for me provided the mom 30 is above zero . If it goes down the zero line it is a short trend for me.
After seeing you trade today I feel that Stoch RSI together with macd and mom30/40 can be great package for scalping against the trend which otherwise has bruised me in past badly
Tryin to be of some use
Attached Image(s) (click to enlarge)