i see that this thread has increased number of readership. however, not willing to participate. ah ........ naked charts.
Ignored
Haha
naked chart is not easy.
lik the structure i try to mark today.
not easy to mark correctly.
but i do hope more people can participate and not scare to post their own view
{quote} Haha naked chart is not easy. lik the structure i try to mark today. not easy to mark correctly. but i do hope more people can participate and not scare to post their own view
Ignored
ict took 6 years to discover and form these.
thanks to him, newbies can take half of the time.
and you took 4 years to learn from some of his students.
{quote} Can you mark for me , how u see gu current strucuture? i try to use 15m -1h chart to mark it, cause 1m-5m may too many fvg to fill so i not sure which Level should i label as ITH or STh/l but i not sure am i right or wrong. this part need more practise and data.
Ignored
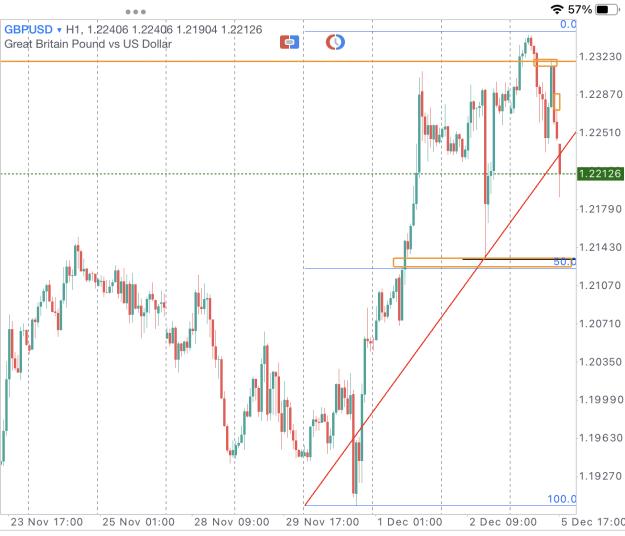
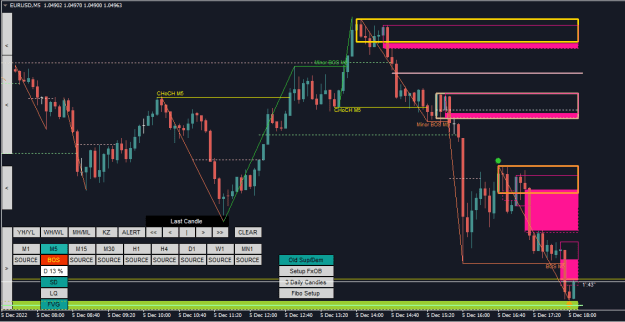
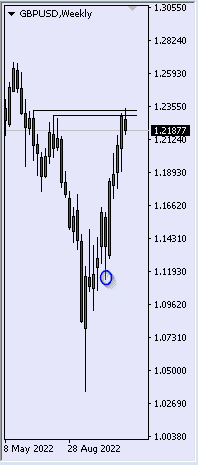
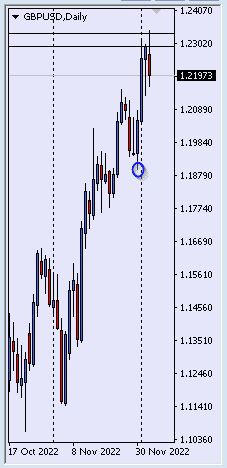
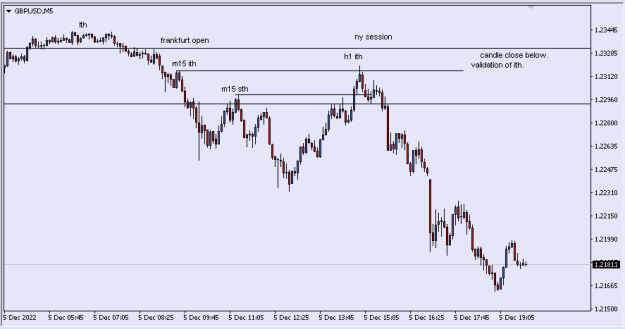
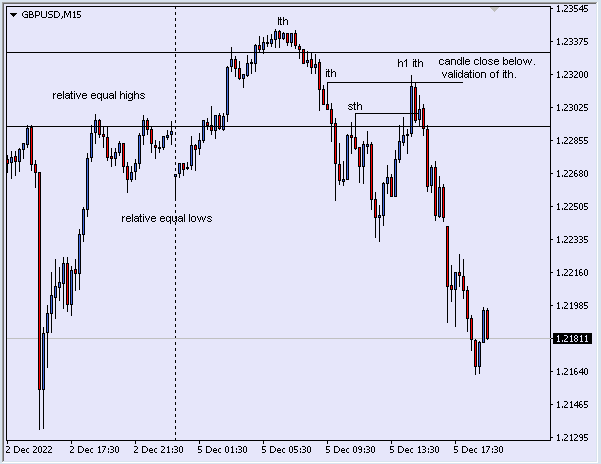
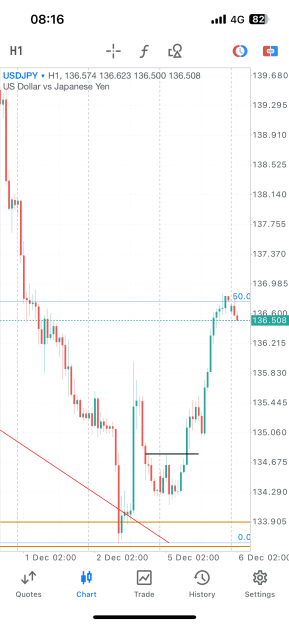
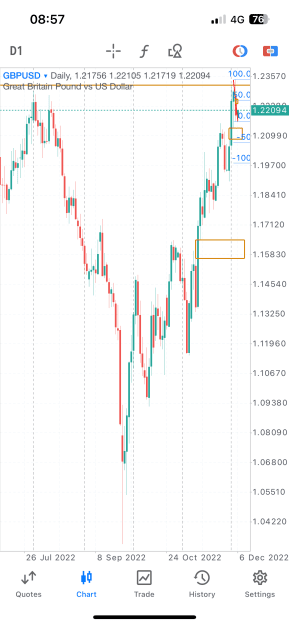
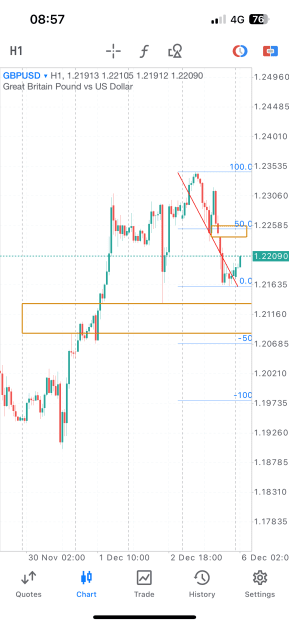
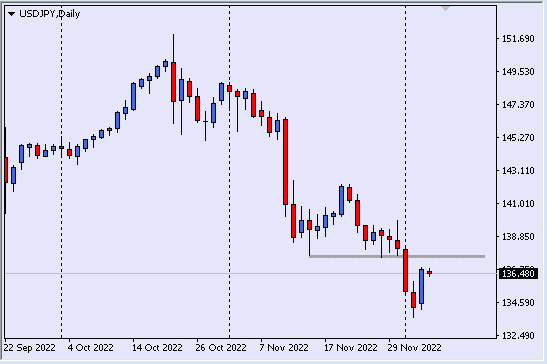
structure from w1 and d1.
both had 3 candle swing low but no 3 candle swing high.
however met with strong resistance.
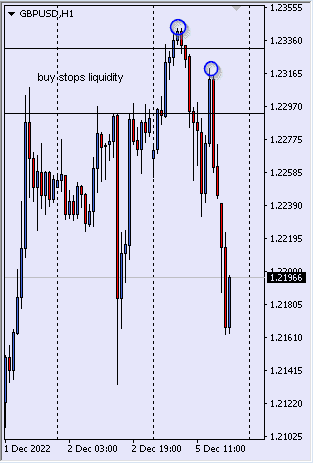
h1 with relative equal high buy stops liquidity and swing high.
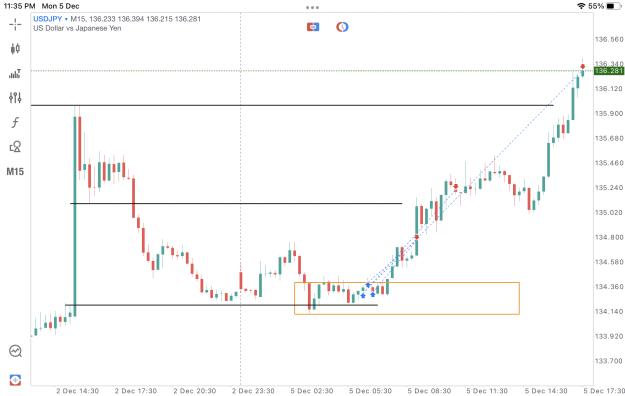
m15 lth ith sth
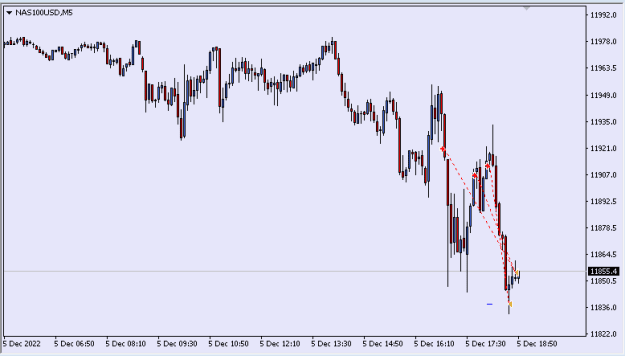
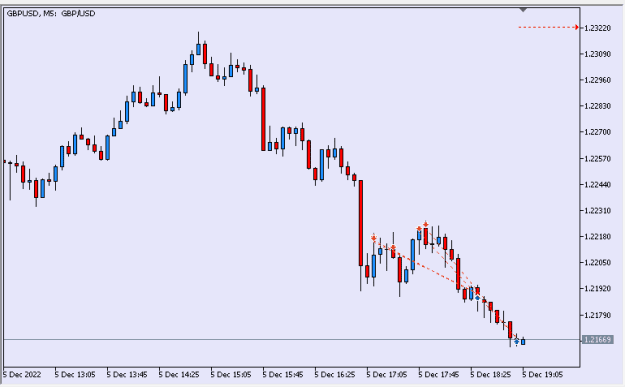
m5 opportunities to short during europe session. and later during new york session.
{quote} structure from w1 and d1. both had 3 candle swing low but no 3 candle swing high. however met with strong resistance. h1 with relative equal high buy stops liquidity and swing high. m15 lth ith sth m5 opportunities to short during europe session. and later during new york session. {image} {image} {image} {image} {image}
Ignored
My ITH marking .
when i saw it burst through then i actually got a feel that is sth ,
cause that is may many trader set stop there.
{quote} structure from w1 and d1. both had 3 candle swing low but no 3 candle swing high. however met with strong resistance. h1 with relative equal high buy stops liquidity and swing high. m15 lth ith sth m5 opportunities to short during europe session. and later during new york session. {image} {image} {image} {image} {image}
Ignored
Can you explain some about 3 candle swing hihh/ low?
what theory behind it to confirm direction?
is it about 3 drive up or drive down?