The Profit Ratio indicator is a financial trading tool that displays the current percentage of winning trades to the losing trades. This data can be used to accurately predict the potential zone where the price of an asset may likely reverse.
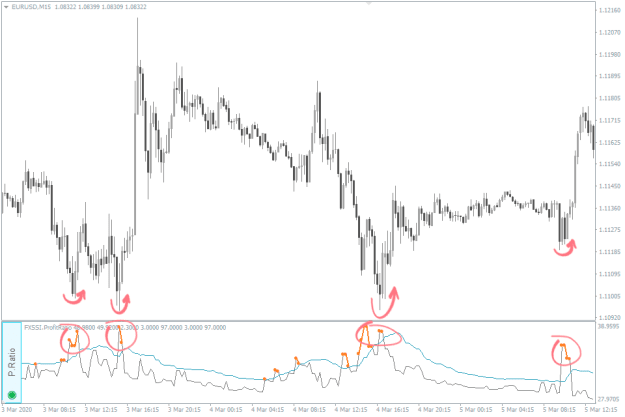
The indicator is very efficient in detecting price reversal level especially at market bottoms.
Besides, it would also be beneficial to counter-trend traders in analyzing the precise reversal level of the price. This invariably minimizes the possibility of your Stop Loss being hit by the main trend due to wrong or premature entries.
The Profit Ratio indicator relies on the data from Order Book to calculate the ratio of winning/losing trades. It simply add and divides the total number of opened lot sizes for each level to determine the Profit Ratio.
So in essence, the indicator was developed to help you in identifying the precise zone of a price reversal, spotting short-and medium-term trends, and finally, identify the true and false movement of the price.
Features of the Indicator
The salient features of the indicator are:
Signal – This comprises the Profit Ratio and signal line.
Delta – This feature analyzes the differences between the previous Profit Ratio and the current value.
Buy: Sell – This feature shows the ratio of winning buyers/sellers. It is used to define short and medium-term trends of the market.
Signal labels – This feature (the orange line) highlights the optimal zones where the price may likely reverse.
Furthermore, the Profit Ratio indicator is configured to automatically accept and download the latest version of the indicator.
How to Trade With the Profit Ratio Indicator
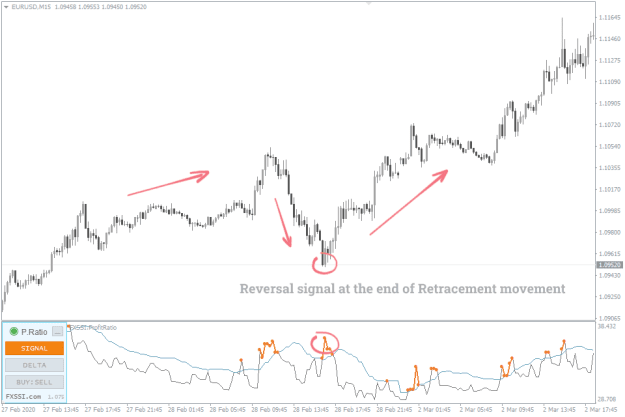
The Profit Ratio indicator is best suited for identifying the price reversal zone (especially the end of a retracement) with high precision. The signal line of the indicator helps you to keep track of the market volatility. Thus, a potential price reversal can be spotted when the Profit Ratio crosses above the signal line.
For instance, to join a bullish trend at the end of a retracement, simply wait for the Profit Ratio to move above the signal line. With this condition, you may then find a BUY entry and ride the trade to the upside.
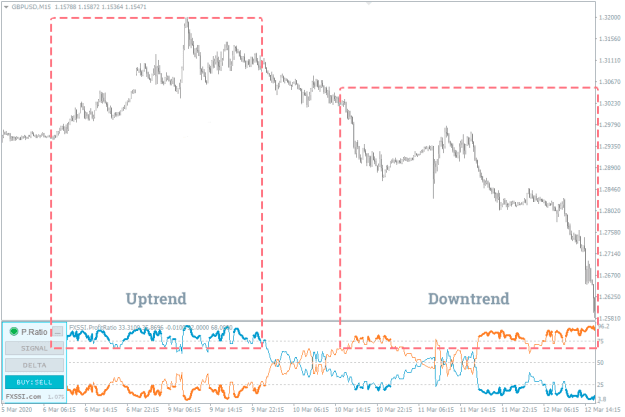
Furthermore, the indicator would also come in handy in analyzing both short and medium-term trends. The thick blue and red line (75% zone) of the indicator is used to define short and medium-term biases.
To spot an uptrend, first, turn on the BUY: SELL function of the indicator. A bullish (uptrend) trend is typified when buyers are above the blue line. Similarly, a downtrend is depicted when sellers are above the red line.
Settings
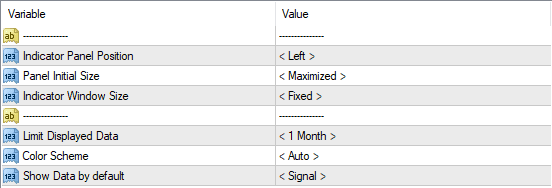
Indicator Panel Position – This parameter defines where the indicator’s panel is placed.
Panel Initial Size – This parameter keeps the panel maximized/minimized at start-up.
Indicator Window Size – This defines the size of the indicator window on your chart.
Limit Displayed Data – This determines the depth of historical data the indicator displays.
Color Scheme – This parameter automatically assigns a color to the indicator that is in sync with your background. Besides, you can also manually choose your desired color from the pallet.
Show Data by default – This defines the type of data to be displayed by the indicator at startup or when switching between different timeframes.
Indicator installation
Download Link
1. Download and unzip the archive to the MQL4 folder of the terminal;
2. Restart the terminal and run the indicator;
3. Allow import of DLLs.
The indicator is very efficient in detecting price reversal level especially at market bottoms.
Besides, it would also be beneficial to counter-trend traders in analyzing the precise reversal level of the price. This invariably minimizes the possibility of your Stop Loss being hit by the main trend due to wrong or premature entries.
The Profit Ratio indicator relies on the data from Order Book to calculate the ratio of winning/losing trades. It simply add and divides the total number of opened lot sizes for each level to determine the Profit Ratio.
So in essence, the indicator was developed to help you in identifying the precise zone of a price reversal, spotting short-and medium-term trends, and finally, identify the true and false movement of the price.
Attached Image (click to enlarge)
Features of the Indicator
The salient features of the indicator are:
Signal – This comprises the Profit Ratio and signal line.
Delta – This feature analyzes the differences between the previous Profit Ratio and the current value.
Buy: Sell – This feature shows the ratio of winning buyers/sellers. It is used to define short and medium-term trends of the market.
Signal labels – This feature (the orange line) highlights the optimal zones where the price may likely reverse.
Furthermore, the Profit Ratio indicator is configured to automatically accept and download the latest version of the indicator.
How to Trade With the Profit Ratio Indicator
The Profit Ratio indicator is best suited for identifying the price reversal zone (especially the end of a retracement) with high precision. The signal line of the indicator helps you to keep track of the market volatility. Thus, a potential price reversal can be spotted when the Profit Ratio crosses above the signal line.
For instance, to join a bullish trend at the end of a retracement, simply wait for the Profit Ratio to move above the signal line. With this condition, you may then find a BUY entry and ride the trade to the upside.
Attached Image (click to enlarge)
Furthermore, the indicator would also come in handy in analyzing both short and medium-term trends. The thick blue and red line (75% zone) of the indicator is used to define short and medium-term biases.
To spot an uptrend, first, turn on the BUY: SELL function of the indicator. A bullish (uptrend) trend is typified when buyers are above the blue line. Similarly, a downtrend is depicted when sellers are above the red line.
Attached Image (click to enlarge)
Settings
Attached Image (click to enlarge)
Indicator Panel Position – This parameter defines where the indicator’s panel is placed.
Panel Initial Size – This parameter keeps the panel maximized/minimized at start-up.
Indicator Window Size – This defines the size of the indicator window on your chart.
Limit Displayed Data – This determines the depth of historical data the indicator displays.
Color Scheme – This parameter automatically assigns a color to the indicator that is in sync with your background. Besides, you can also manually choose your desired color from the pallet.
Show Data by default – This defines the type of data to be displayed by the indicator at startup or when switching between different timeframes.
Indicator installation
Download Link
1. Download and unzip the archive to the MQL4 folder of the terminal;
2. Restart the terminal and run the indicator;
3. Allow import of DLLs.