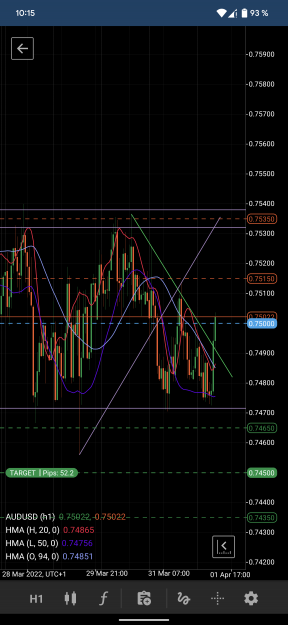
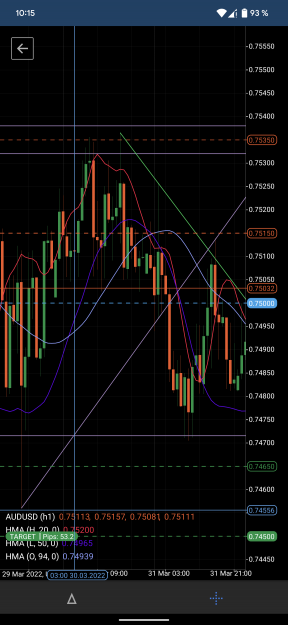
Hello guys, just fast interesting fact. We can find a point in time and place that will work in future. For example we "can" or we "could" make a point a time that will show where some high or low will happen. We don't know when and where but it will be self explanatory. For example look at those 4 charts.
No explanation for now since I am on phone but I will let you find it and decide....
So is there anyone who will find what I mean? It's literally just written in chart.
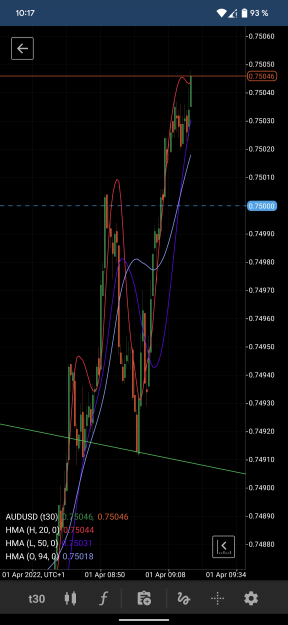
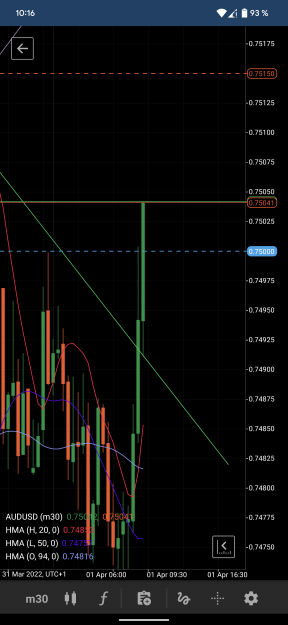
Look at the pictures from the bottom upwards. Sorry, I don't know how to add the pictures in order as they should be.
EDIT 1 - We don't need trend or anything. We will just trade those as price is touches them. For example touch from high is buy, touch from below is sell. Stoploss not needed because price reverses immediately. I worked with this year's ago but I never really made a perfect system with it. It just worked, sometimes price never touched them, so no trade at all.
EDIT 2 - First two pictures are great. Look at second chart. We have simple trendline (this is not what you should find.. I'm preparing future trades for me) but it's 30 minute chart. How can you trade the exact low as new candle opens? Well simply use tick chart. (FIRST CHART) You can see then, how price react amazingly and goes up. This is it.
See you soon,
SF
No explanation for now since I am on phone but I will let you find it and decide....
So is there anyone who will find what I mean? It's literally just written in chart.
Look at the pictures from the bottom upwards. Sorry, I don't know how to add the pictures in order as they should be.
EDIT 1 - We don't need trend or anything. We will just trade those as price is touches them. For example touch from high is buy, touch from below is sell. Stoploss not needed because price reverses immediately. I worked with this year's ago but I never really made a perfect system with it. It just worked, sometimes price never touched them, so no trade at all.
EDIT 2 - First two pictures are great. Look at second chart. We have simple trendline (this is not what you should find.. I'm preparing future trades for me) but it's 30 minute chart. How can you trade the exact low as new candle opens? Well simply use tick chart. (FIRST CHART) You can see then, how price react amazingly and goes up. This is it.
See you soon,
SF
Attached Image(s) (click to enlarge)