I really can’t find what I miss. I’m checking the same pair (GBPUSD), same date and time (March 17 2021 from close of 08:00 until close of 10:00).
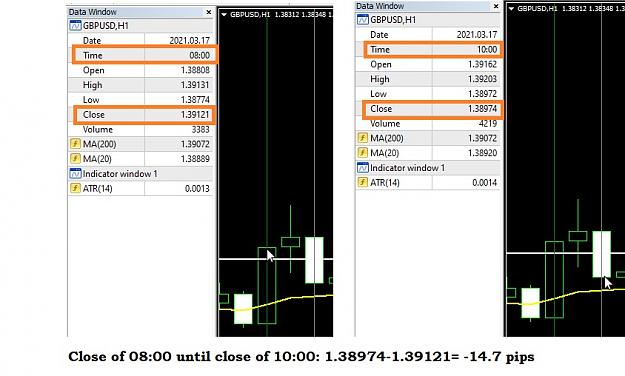
The H1 chart starting from close 08:00 candle (green vertical line) until close 10:00 candle (grey vertical line) shows a total difference of -14.7 pips.
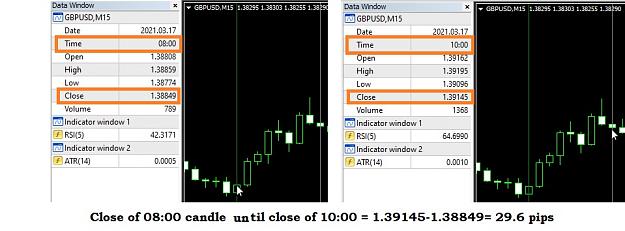
The M15 chart of the exact same period of time (8 candles length instead of 2 which makes sense for 4x smaller TF) from close 08:00 candle (green vertical line) until close 10:00 candle (grey vertical line) shows a total difference of +29.6 pips.
What am I missing? Starts to get on my nerves!
The H1 chart starting from close 08:00 candle (green vertical line) until close 10:00 candle (grey vertical line) shows a total difference of -14.7 pips.
The M15 chart of the exact same period of time (8 candles length instead of 2 which makes sense for 4x smaller TF) from close 08:00 candle (green vertical line) until close 10:00 candle (grey vertical line) shows a total difference of +29.6 pips.
What am I missing? Starts to get on my nerves!
Attached Image(s) (click to enlarge)