Hello Everyone,
I am pleased to share some knowledge in trading from what I discovered a few years ago this is my first thread here on Forex Factory, I must say thank you to those fine folks for allowing me the privilege here to do just that.
THE CHART:
Japanese candlesticks,horizontal,vertical lines and possibly zig zag indicator,this will help you identify HH,LH,LH,LL (little or no indicators required)
THE SYSTEM:
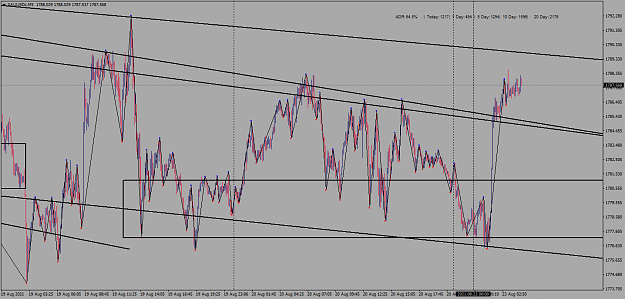
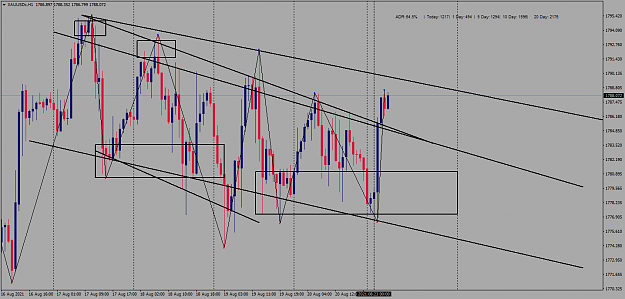
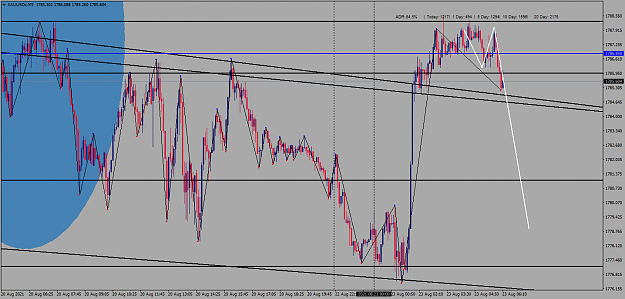
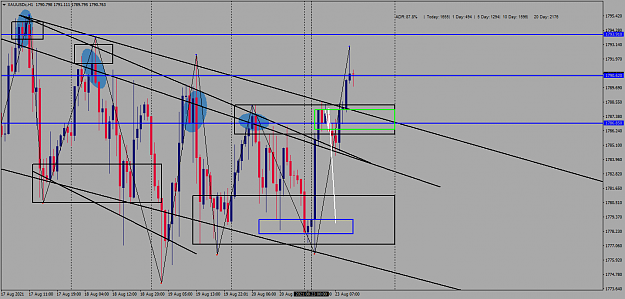
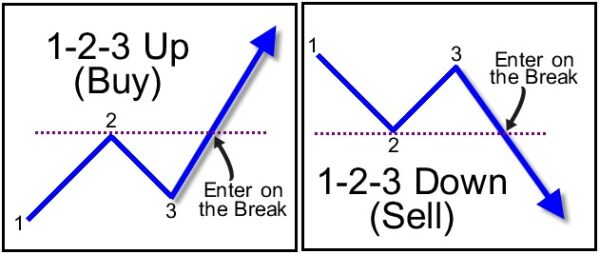
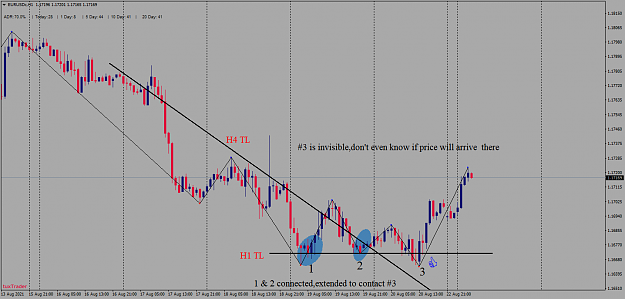
1. Identify the main trend on a higher timeframe.This would be the Daily/H4 if you need entries on H1,just an example.Looking for a clear trend is essential allowing you to draw trendlines connection points 1,2 & 3. When you establish the above on HTF it's much easier viewing LTF price action.What you don't want on HTF is congestions and too many spikes not allowing a clear run for your trend line (TL).
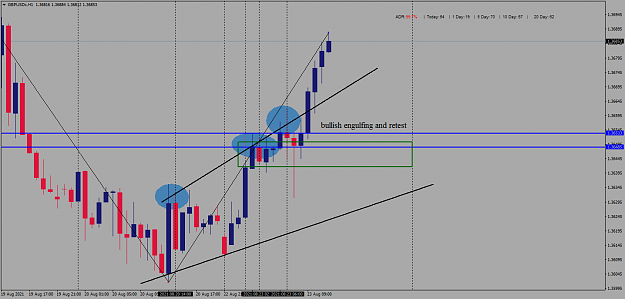
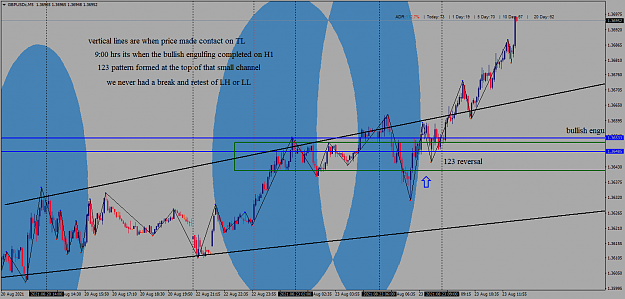
2. When trend lines are drawn,LTF entries can be taken.What you have to look at when price makes contact at 1/2/3 points are candles breaching the TL and closing within the main trend.Let's say the trend is down,you sell or go short ,you have a TL at a slope from high to low and points 1/2 are connected,price will retrace to another point calling this #3,candle need to breach that area and close inside your structure to become a valid sell. Of course the opposite will apply for buys/longs,screenshots and detailed descriptions will be posted.
3. Buy/Sell on LTF only if HTF framework has been established.There is more to this than meets the eye and that's where the magic unfolds!
More to come soon.....
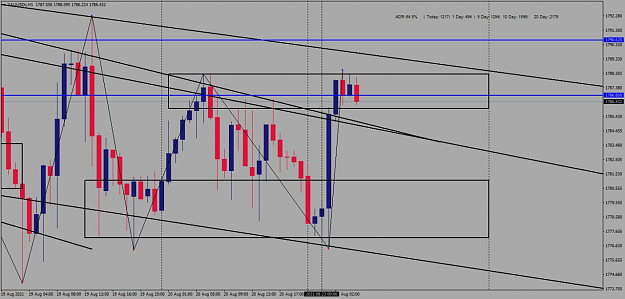
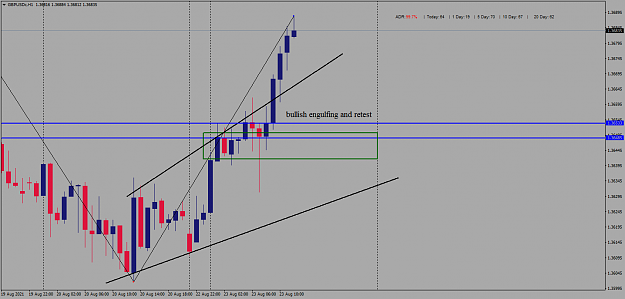
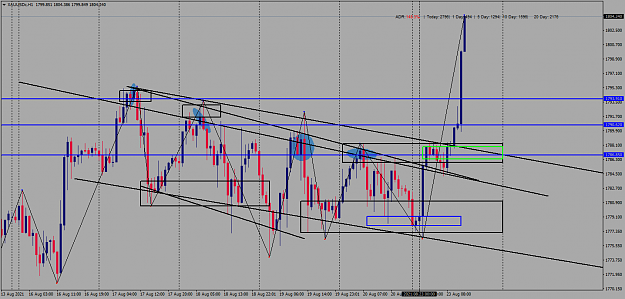
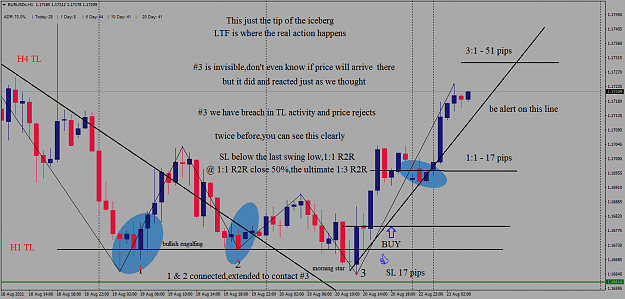
4. Trade Management illustrated in screenshot EURUSD attached.You'll aim for 1:1 risk using SL at previous swing low or ATR if you're fine using that calculation.
At 1:1 target close 50% of your position/s and leave to run until 3:1
I am pleased to share some knowledge in trading from what I discovered a few years ago this is my first thread here on Forex Factory, I must say thank you to those fine folks for allowing me the privilege here to do just that.
THE CHART:
Japanese candlesticks,horizontal,vertical lines and possibly zig zag indicator,this will help you identify HH,LH,LH,LL (little or no indicators required)
THE SYSTEM:
1. Identify the main trend on a higher timeframe.This would be the Daily/H4 if you need entries on H1,just an example.Looking for a clear trend is essential allowing you to draw trendlines connection points 1,2 & 3. When you establish the above on HTF it's much easier viewing LTF price action.What you don't want on HTF is congestions and too many spikes not allowing a clear run for your trend line (TL).
2. When trend lines are drawn,LTF entries can be taken.What you have to look at when price makes contact at 1/2/3 points are candles breaching the TL and closing within the main trend.Let's say the trend is down,you sell or go short ,you have a TL at a slope from high to low and points 1/2 are connected,price will retrace to another point calling this #3,candle need to breach that area and close inside your structure to become a valid sell. Of course the opposite will apply for buys/longs,screenshots and detailed descriptions will be posted.
3. Buy/Sell on LTF only if HTF framework has been established.There is more to this than meets the eye and that's where the magic unfolds!
More to come soon.....
4. Trade Management illustrated in screenshot EURUSD attached.You'll aim for 1:1 risk using SL at previous swing low or ATR if you're fine using that calculation.
At 1:1 target close 50% of your position/s and leave to run until 3:1
Attached Image (click to enlarge)
Attached Image (click to enlarge)
Attached File(s)