Question on absolute basics of method
Vantages post I was refering to..
V..... was discussing general trading ideas with someone that is just starting his journey. It often helps to tie up concepts with a concise summary.
It comes down to: 1hr flow in line with D view. Essentially thats it.
If it appears that D view is not working then counter trend rules come into play: proven support and resistance levels and W pivots, when price has proven over a period of several hours that it does not want to continue in trend (specifically not 1 x 1hr candle).
We really want to see good 1hr flow.
Some examples to expand the idea. Taking my early morning view of 21 June as a basis for discussion. Going into the day I made this general comment:
It does not seem that there were strong Asian buyers for EUR and GU this morning. Makes me think there is chance of move down continuing. We'll see what candles give us.
The general view for EUR was:
EUR - D closed negative with a decent lower wick, RSI has crossed below 50 level. 4hr RSI crossed up but could easily flip over. We are moving up to a support/resistance level around W M2 1.3260 and if we are headed lower that would be a level to watch out for. No bias can go either way.
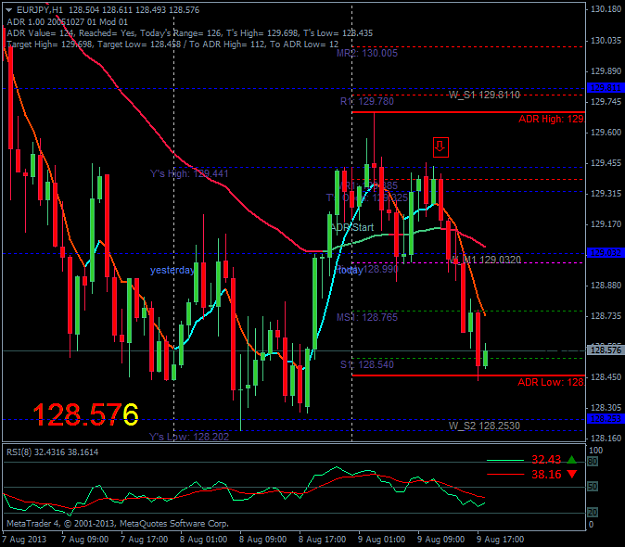
Going into LO on 4hr we had a shooting star. On 1hr the arrows up show the sequence of higher lows and higher highs i.e. short term uptrend. The x shows where the flow shows first change with a shooting star that makes a lower high, the arrows down show where this one hour flow changed. So if your D view was down you could be looking to enter after the 1hr shooting star marked X as the immediate flow is back in line with the biggerpicture. There is another 1hr lower high going into the US session.
So now D down, 4hr shooting star before London open and a 2nd going into US open, 1hr flow confirming move down.
Vantages post I was refering to..
V..... was discussing general trading ideas with someone that is just starting his journey. It often helps to tie up concepts with a concise summary.
It comes down to: 1hr flow in line with D view. Essentially thats it.
If it appears that D view is not working then counter trend rules come into play: proven support and resistance levels and W pivots, when price has proven over a period of several hours that it does not want to continue in trend (specifically not 1 x 1hr candle).
We really want to see good 1hr flow.
Some examples to expand the idea. Taking my early morning view of 21 June as a basis for discussion. Going into the day I made this general comment:
It does not seem that there were strong Asian buyers for EUR and GU this morning. Makes me think there is chance of move down continuing. We'll see what candles give us.
The general view for EUR was:
EUR - D closed negative with a decent lower wick, RSI has crossed below 50 level. 4hr RSI crossed up but could easily flip over. We are moving up to a support/resistance level around W M2 1.3260 and if we are headed lower that would be a level to watch out for. No bias can go either way.
Going into LO on 4hr we had a shooting star. On 1hr the arrows up show the sequence of higher lows and higher highs i.e. short term uptrend. The x shows where the flow shows first change with a shooting star that makes a lower high, the arrows down show where this one hour flow changed. So if your D view was down you could be looking to enter after the 1hr shooting star marked X as the immediate flow is back in line with the biggerpicture. There is another 1hr lower high going into the US session.
So now D down, 4hr shooting star before London open and a 2nd going into US open, 1hr flow confirming move down.