I aim for 50 pips a day, if I don't get it I'm not going to worry though.
Ignored
A few days ago didn't take 1 trade in London session and then had to go out so didn't trade at all that day. Thats never been a concern. I'm happy my system has the right % win ratio, and winners are biggers than losers. But then I've looked at a lot of charts.
Hey V, I'm not sure if you've answered this before so I apologize if you have. How is your screen setup as far as what charts you have up? Do you have the 1 hr, 15 and 5 up at one time or do you switch back and forth? Just wondering how you're doing it. Thanks.
Yeah thanks- i think one of my problems is that i am in too much of a rush! I need to stick to at least the 15 min chart rather than the 5min. I am looking for entries too hard rather than the entries jumping out at me. Sorry if u said this before but currently what sort of R & R are you aiming for? -cheers
Ignored
What I meant by check charts is you need to do a lot of homework looking back over charts checking that the set up you envisage trading does work. Literally look at months of charts. I ususally say 20 days uptrend, 20 days sideways, 20 days downtrend. If your method stands up under those circumstances then you can be quite confident your method will hold up.
What I meant by check charts is you need to do a lot of homework looking back over charts checking that the set up you envisage trading does work. Literally look at months of charts. I ususally say 20 days uptrend, 20 days sideways, 20 days downtrend. If your method stands up under those circumstances then you can be quite confident your method will hold up.
Ignored
I have 4 screens. 1 has daily and 4hr on for gu, eu and ej. 1 has 15 min, 5 min, 1 hr and 1 min for each of the 3 currencies.
On the eu screen I sneak on uc so that I can confirm that eu and uc are doing the right things for gu trade.
Hi V
Does that mean that -10 was the stop position above the high of the entry pattern? That means it was the 9th bar, or so, after the entry bar that you closed the position, is that right?
And do your 4 monitors each show a separate instance of MT4, or is there one MT4 that spreads across 4 monitors? If the first, is there a common template and indicator folder that each instance accesses? I know, questions, questions.....
Ignored
-10 total, the entry candles were narrow, stop was above candles high.
4 screens, 1 mt4 chart spread right across, mouse scrolls across all 4 screens. Take computer, 2 video cards + 1 man from shop to set up, easy. No way I coulda done it!!
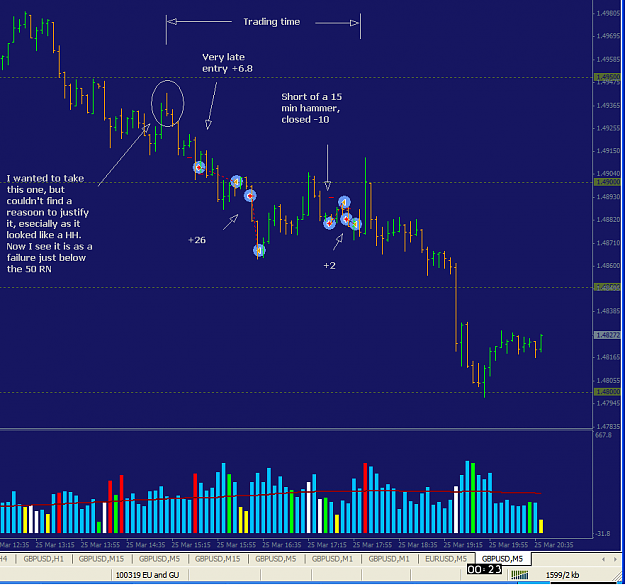
Left arrow down. A debatable one, 1 hr was down but 15 mins was up but on very low vol. We sold in view of very low vol move up on 15 min. Stopped out but we saw that coming and had a buy set up see 1st arrow up.
Nice run up and no real contradictions we thought from 15 min chart. The 3rd arrow up was also debatable, this 5 min coincided with a nice hammer on 15 min and we thought OK as there was also good space between entry and previous high (just in case it turned out to be a lh).
Missed the last news push up as we had already exited.
150 pip range now done, charts up but I think we are also done.
Left arrow down. A debatable one, 1 hr was down but 15 mins was up but on very low vol. We sold in view of very low vol move up on 15 min. Stopped out but we saw that coming and had a buy set up see 1st arrow up.
Nice run up and no real contradictions we thought from 15 min chart. The 3rd arrow up was also debatable, this 5 min coincided with a nice hammer on 15 min and we thought OK as there was also good space between entry and previous high (just in case it turned out to be a lh).
Missed...
Ignored
Morning V
very nicely done today. Getting an early start really pays off. Can I ask what criteria you used for the exits on those trades?
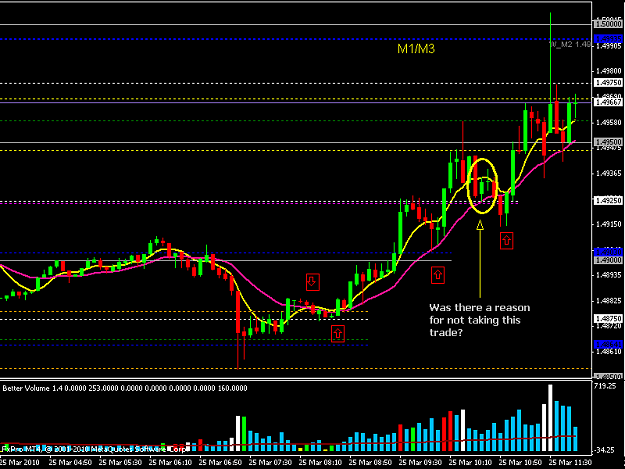
I have also attached a picture and see a signal you did not take. Was there a specific reason for avoiding that trade?
Sorry, re read your post again. I am guessing you did not take the trade because it did not look "right" on the 15 min so close the doji. Once the 15 min started forming a upwards hammer, it looked "better"
Sorry, re read your post again. I am guessing you did not take the trade because it did not look "right" on the 15 min so close the doji. Once the 15 min started forming a upwards hammer, it looked "better"
Ignored
100% the good vol doji was a definite indication of a pause in the move up, see arrow down.
I have attached the 15 min.
Just wanted to stress that the sell we took after the very low vol move up, see arrow up, was done in the likely knowledge that if we got it wrong then we were buying. We had the buy set up even before our stop was hit.
Our hl/lh off 5 min as long as there are no obvious contras from 15 min is working well for us I must say.
Ignored
Perhaps some clarification, if we are buying we are careful any time we see large upper wicks on 15 min chart. So if we see a large range doji or any kind of shooting star we would certainly pause. Yes of course these candles can fail and move up immediately but odds are there will be some kind of retracement.
PS a small range doji is a different animal. I've never done a study, the doji above was 30 pips almost, definite reason to make you hesitate.
Can I ask what criteria you used for the exits on those trades?
Ignored
Today was a good day and we are still trying to balance the bank v let run debate, NB Mrs V is more of a scalper than I so thats not helping. She is definitely in the you don't go bust with pips in the bank mold.
Having said that there are definitely days where we end up with 20-30 pips in a 125 pip run because we banked and didn't like re-entry candles.
OK so 1st target was the pivot (purple line) and 4925 psych combo.
2nd target was 50% of y's range (yellow line) and 4950 combo.
3rd target was 4975, 38% off y's high (also yellow line), 125 pip range for session combo.
Oh and yes the debate is on as to whether we should look at 150 range and not 125, we'll see.
The red lines are the exit levels. If we get out either right on those levels (or just a pip or two lower) we are happy to re-enter a nice hl. The reason being is if price goes up we are in again at a similar or better price. If price fails and re-entry loses then our original trade would most likely have been down the toilet as well.
1st exit at 4925, ok after spread re-entry was very close to exit.
Arrow right re-entry was over 15 pips more favourable after 2nd entry spread as the prev exit was 4950.
Again this was a day where things went well, its not always like that. Eg some days you have large upper wicks and price ignores, no real retrace and just goes up. Its all a balance and being happy with what you are getting and not being too upset when you exit and cannot get in again. We have after all made the decisions.
Hey V I have a random question for you or anyone else who wants to give me their suggestions. Do you listen to music or watch tv or anything while you trade? Normally I have some music going on but today I turned on the tv and had on CNBC to have some background noise. I find if I have nothing on I get bored a lot quicker and get distracted but if I'm listening to music or have the tv on I'm more focused. As long the tv isn't something I really want to watch or else I find myself watching tv instead of trading. Thanks.
Thanks for the detailed explanations, V, much appreciated. It provides a nice clear picture of how you are trading. I am becoming much more aware of how much information the 15 min chart can provide.
The question of how much of a daily move is still available is a tricky one.
For your information,the average daily range over the last 20 days is 188 pips on GU, and today has hit 207 as I write. A while back, I did some Excel crunching on ADR's and noticed that there is a majority of days under the ADR and a minority larger than the ADR. Something like 60/40 ish. But that big range days moved significantly further past the ADR than the small days moved under. In other words, if it is going to be a large range day the odds are in favour of it moving well past the average. Essentially, it pays to make hay while the sun is shining.... I found that having ADR information available made me hesitant to take trades if price had already moved, say 75%, of the ADR. Given that you want to be in a large range day, that itself annoyed me so much that I removed all that kind of information in favour of a simpler philosophy. If it is going up, get long, and if it is going down, get short. Then the question becomes when is it going up and when is it going down. Which is what your thread is about, really.
I downloaded the FXPro demo, and used it this afternoon. I find 5 digits not so easy to use, but I guess it is only a question of time. The attached chart is some trades from this afternoon.
Hey V I have a random question for you or anyone else who wants to give me their suggestions. Do you listen to music or watch tv or anything while you trade? Normally I have some music going on but today I turned on the tv and had on CNBC to have some background noise. I find if I have nothing on I get bored a lot quicker and get distracted but if I'm listening to music or have the tv on I'm more focused. As long the tv isn't something I really want to watch or else I find myself watching tv instead of trading. Thanks.
trublu
Ignored
My distractions are FF!! Mrs V is also around and we discuss set ups etc what we see coming. So I'm prob in a small minority of traders there. No I don't listen to tv or music. If tv etc works for you, thats the key thing, use it.
Thanks for the detailed explanations, V, much appreciated. It provides a nice clear picture of how you are trading. I am becoming much more aware of how much information the 15 min chart can provide.
The question of how much of a daily move is still available is a tricky one.
For your information,the average daily range over the last 20 days is 188 pips on GU, and today has hit 207 as I write. A while back, I did some Excel crunching on ADR's and noticed that there is a majority of days under the ADR and a minority larger than the ADR. Something...
Ignored
Hi Royston
The idea of 125 range came in as 'sometimes' trading can get very erractic at the end of a run, again as much as we dream of every day being 150 pip days (yeah right) we had a good look at decent moves and decided 125 pips a decent daily range target that once reached we are happy to calm down to a panic. We are considering 150 we'll see. So if we have missed a run down we would be very, very careful about entering anything after a big move.
If my info is correct your losing trade came after a a high vol hammer at 2.30 pm gmt, 15 min chart. Also I believe Bernanke was testifying at that time so I'd also have not traded.