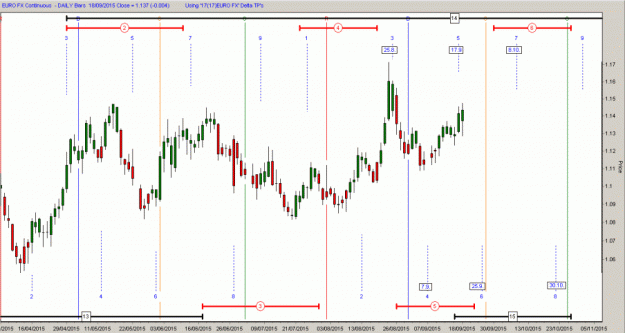
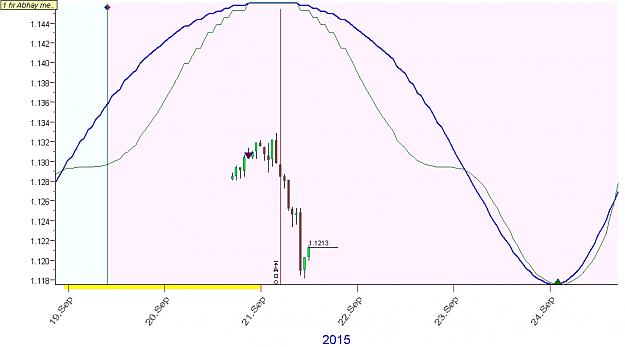
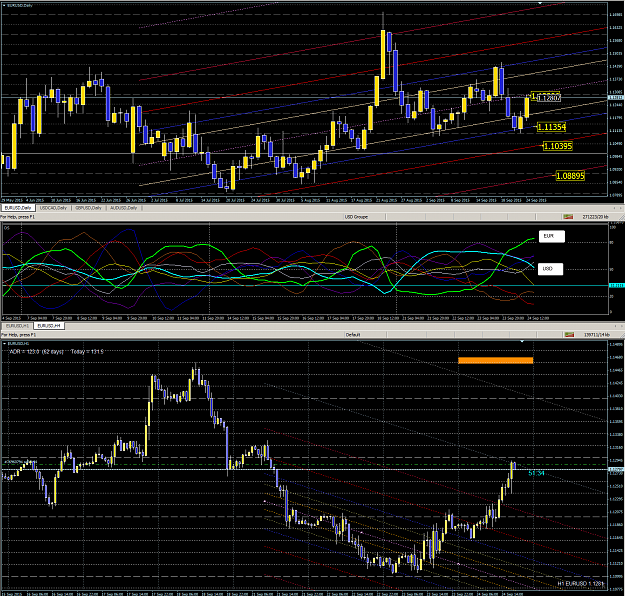
DislikedThis is the current 1h chart of euro on TS. Also a simple chart with fib and a trendline support. Jnevins, I don't know how you fit the projection lines to candles, as they don't seem to fit on my chart? Any clues? If I go by my chart, it seems like the current drop is into a cycle trough of the projection. {image} {image}Ignored
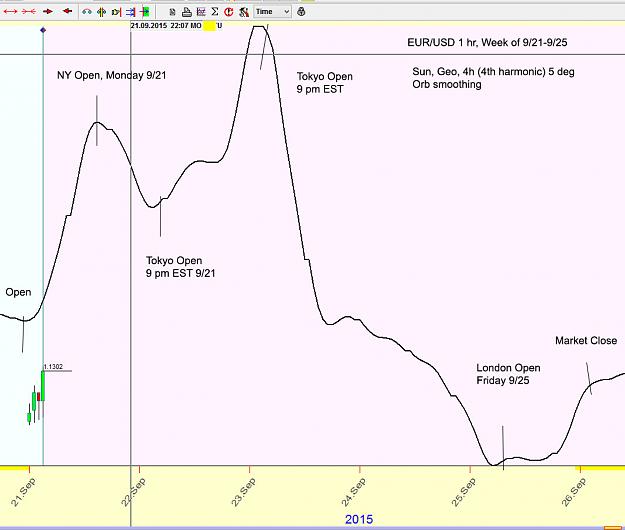
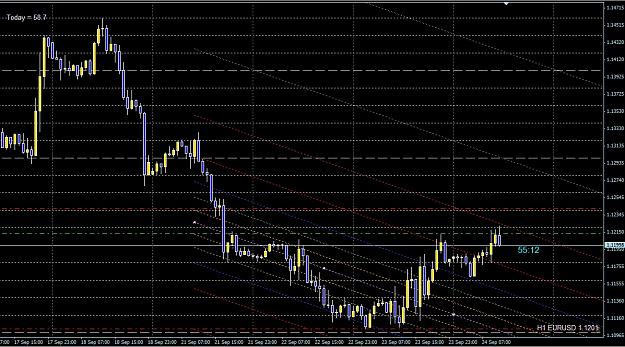
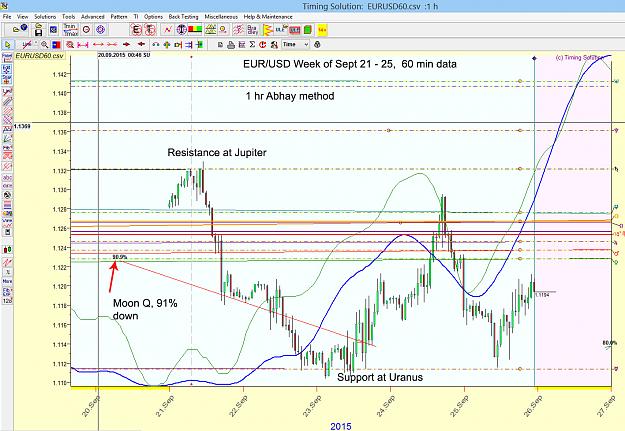
What time zone are you in? When I load the 1 hr data exported from my MT4 platform, I double click the file, EURUSD60.csv then click the Exchange Location button and choose New York... It is defaulting to "trading starts at 9:30 am"... when the NYSE opens... My MT4 data is Central European Time... so if we align all of those parameters, the curve should come out looking like mine... Here is my data to try with your platform...
Attached File(s)