they say we cant time the market?
"u cant forecast price"
"u cant time a swing"
BS.
Ignored
That's not the point. After a turn or a swing has materialised, any system in retrospect can be said as able to time it, even simple indicators like stochastic. The point is, dare you say it would definitely be an upswing beforehand, or would it be a continuation?
That's not the point. After a turn or a swing has materialised, any system in retrospect can be said as able to time it, even simple indicators like stochastic. The point is, dare you say it would definitely be an upswing beforehand, or would it be a continuation?
All systems are wonderful in retrospect.
Ignored
of course, but many are looking down to time traders.
of course, but many are looking down to time traders.
just rying to make a point
Ignored
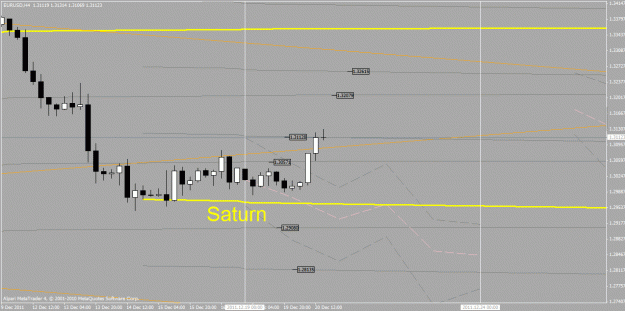
It was venus square saturn.
But it was not a hit in price and time.
Actually 3050 was the opposition price of the aspect, a 180 degrees shift.
So, I wouldn't put to much value on this one.
The price of the aspect may act as a support now, but 2960 is the level to watch for support and 3200 for resistance.
Ignored
hmm my se aspecatiran is bugging maybe it was showing opposition..
perhaps i should look for another source
Anyone noticed this week the correlation between Havel, North Korea and Saab?
It's not just the markets that teach us. The longest lasting ticker with the most accurate history files is called "the daily news" and it's absolutely freely available all over the internet.
BTW, JR97 has posted Helio Venus 144° Earth cycle. And just moved it on next High / Low. And again...
Ignored
You got it. good job.
As far as where I came up with it? I do "joke" astro all the time. Astro that begins with the letter "m", flatuation planets (gas planets), and for this one, I chose "every dude's fantasy" planets or "twin sister" planets. How scientific, eh? 144 was just a random number I pulled out of the planet Myanus.
but yeah.. I seriously come up with planetary combos based on whatever joke I feel like trading. I need to come up with a band camp planet combo. (probably doesn't make sense unless you've seen American Pie).
hey sti, that lines on ur regular vids are they planetary support resistance lines?
Ignored
Hey Buma,
thos lines are the statistical movement of price based on all the planet's longitudes at that moment.
So in other words, i have a huge database with historic price movements, re-partitioned per planet per degree. Then I look at the current degrees and pick from the database the price movements, just adding them together and that forms bars. then the pink line is from the close of each daily bar to the close of the next daily bar. (my database is daily)
For intraday movements I use the moon, the moon, the moon and lilith, lilith, lilith, idea the same as for other planets but then database is H4 and not daily.
Sometimes I have added the yellow lines in the films, those are the single planetary lines I use, very similar the that indicator floating around here somewhere called PlanetLines. The difference is, that mine is drawing the planet lines only then when they are at important longitudes and they always "fix" themselves to price on the first bar of occurance.
The pink lines also fix to price. it's a little trick i use to iron out movements caused by things that i have no knowledge of (and sometimes fundamental news can be driven by non-astro events).
When i started this work i had the dream of creating 1 line that would draw the perfect future, but that's not possible, so i break it up in weeks and fix each week to price. problems solved for a very big part.
thos lines are the statistical movement of price based on all the planet's longitudes at that moment.
So in other words, i have a huge database with historic price movements, re-partitioned per planet per degree. Then I look at the current degrees and pick from the database the price movements, just adding them together and that forms bars. then the pink line is from the close of each daily bar to the close of the next daily bar. (my database is daily)
For intraday movements I use the moon, the moon, the moon and lilith, lilith,...
Ignored
wow nice mate,
yeah i heard the moon is a good short term harmony with forex
do u by any chance know how to draw planetary res. sup. lines by hand? maybe im dreaming....
Well I thought about that... i think the best way to do it, but without programming it is a bit tedious. Is to use metatrader to save the current ticker as CSV file. then it gives dates, OHLC, and volumes.
then import it into something like Excel, create extra columns for the planets and find all longitude degrees for each of the dates
then you can take the upcoming week, look at each day, look at each planet, sort the excel based on the planet you're looking at, go to the degree you need, take all OHLC you find and merge time all together.
tedious...
The problem with this is, that EURUSD has official history only until 1999, it's not enough for Saturn
Well I thought about that... i think the best way to do it, but without programming it is a bit tedious. Is to use metatrader to save the current ticker as CSV file. then it gives dates, OHLC, and volumes.
then import it into something like Excel, create extra columns for the planets and find all longitude degrees for each of the dates
then you can take the upcoming week, look at each day, look at each planet, sort the excel based on the planet you're looking at, go to the degree you need, take all OHLC you find and merge time all together....
Ignored
yeah im not too indie fancy i like drawing things out... silly buma
saturn yeah has big orbits and slow planet. and my least favorite planet. It sounds a little too much for my brain to do it and merge time and OHLC and create point or a planetary curve line. if you come up with somethign like that would be cool to show ur works here
Joined Apr 2004
|
Status: #slack pricetimeforecast
|1,934 Posts
I've been playing around with some astro square of 9 techniques. For the S&P I'm showing square aspects on 12/23 and square numbers of 1188 and 1154. (1172 for mid). 1172 might end up being the stronger number overall, though.
After 12/23, the next squaring is 12/28. (there is a trine on 12/26, but not sure how that would play out being the monday after xmas.)
despite the spike up i'm going to try to stay in the trade, would love to see a 1.287's... having a SL at 1.316
Ignored
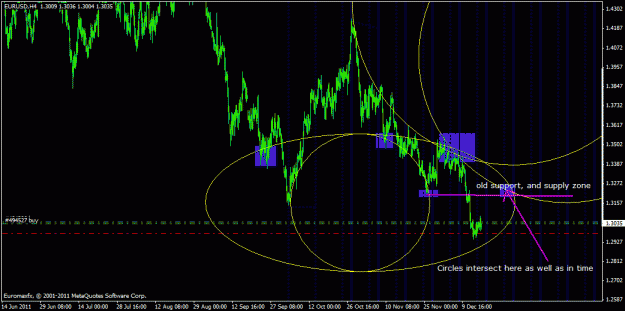
a retest of 3200 is very possible just saying here was my forecast previously. deleted the charts but look at it now is doing quite beautiful to get the retest.
but i wish u luck mate i jsut try to play any direction
sad i dont have the current chart.. woudl look nice
That's a good looking picture yes.
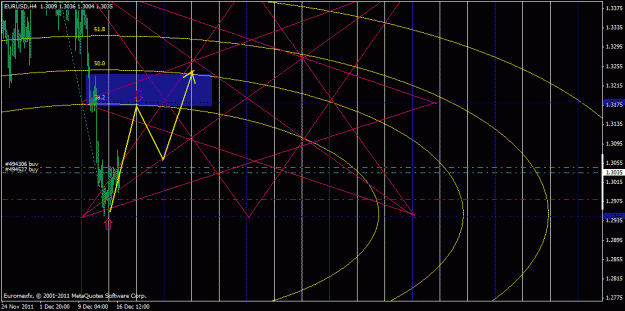
your red diagonals on the bottom pic are based on fibo? and then completing the mirrors to that?
Ignored
gann square buddy manual draw, the fib arc is used to help me see posssible price/time with a circular s/r points and also confluences most of the time with supply demand zones