Hello,
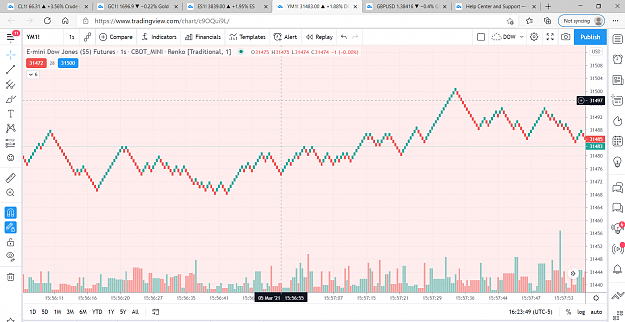
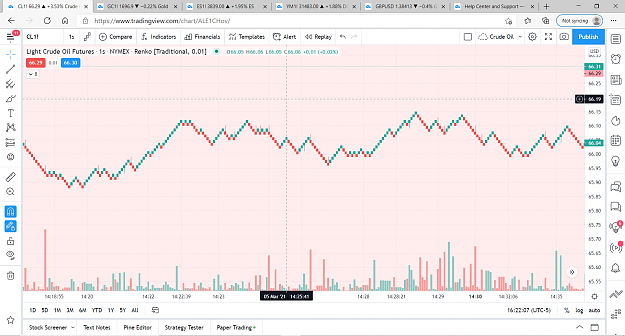
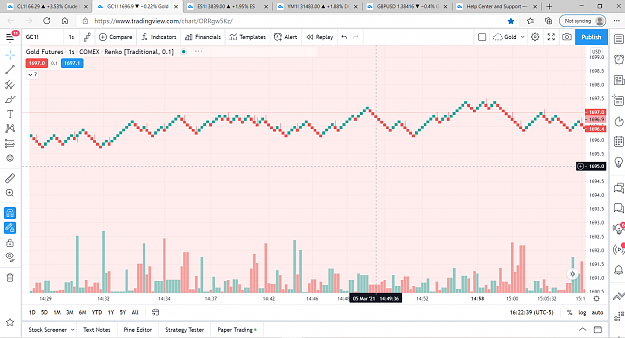
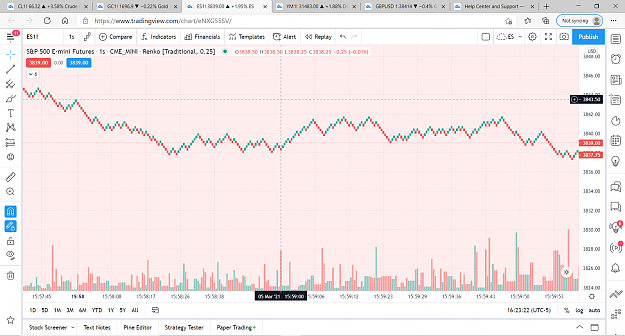
I've noticed an issue with using renko charts for Crude oil and Gold futures. What's happening is wicks are being formed on the renko boxes when a new brick should be forming. However, when I look at an ES or YM futures chart, this doesn't happen despite the same exact settings being used on all the charts. I set up renko charts for all the instruments using a 1 tick brick size to illustrate my point. In theory, there shouldn't be any wicks on the charts because is price traveled 2 ticks in the opposite direction, a new brick would be formed instead of a wick forming. If anyone has any ideas or experience as to why this is happening I would greatly appreciate hearing it!
(sorry if this is posted in the wrong section but it looked like the most viable one to post it in)
Attached Image(s) (click to enlarge)