I decided to start a new thread because I'd like to gather all my charts in one place.
Purpose of this journal is to share the uncommon knowledge and to fight and win with ego of mine .
.
also I have a short memory so want to keep my ideas alive.
So lets start
I am focusing on a few pairs only from now (3.09.2008):
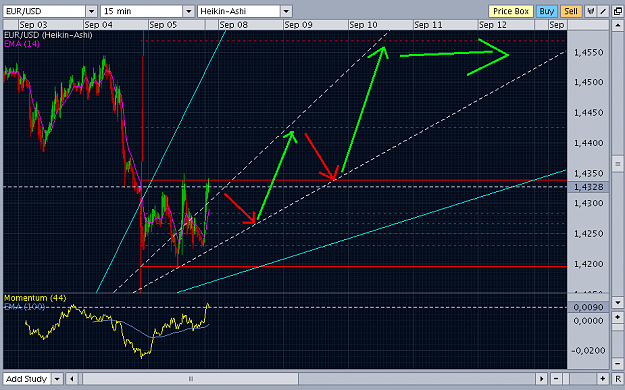
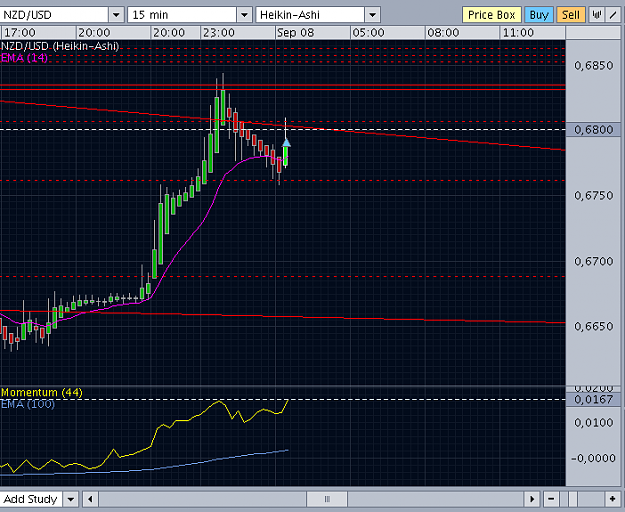
1) EUR/USD(or USD/CHF) aussie, kiwi - follow the white rabbit style also called equilibrium style. Just love to name stuff into my way.
FTWR
equilibrium style
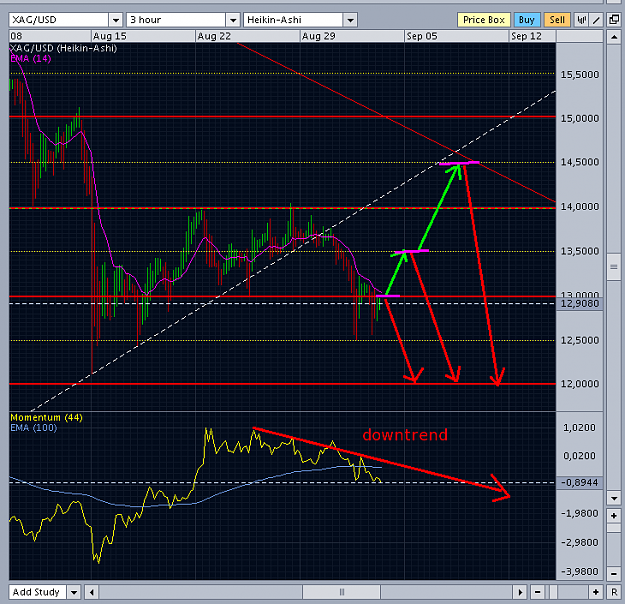
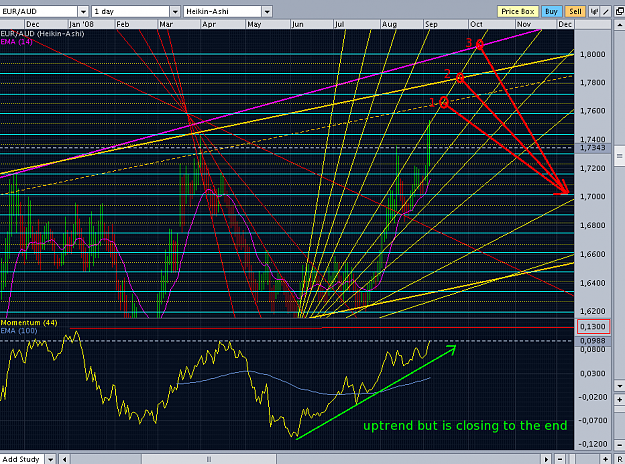
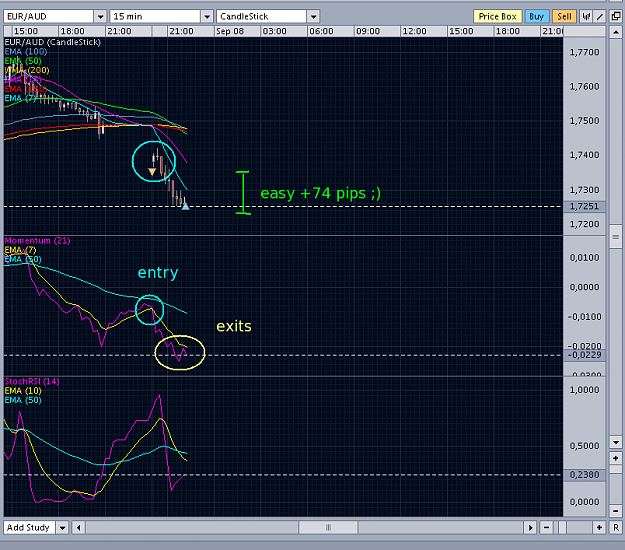
2) EUR/AUD and SILVER trade with - level trading
level trading
entry/exit explanation
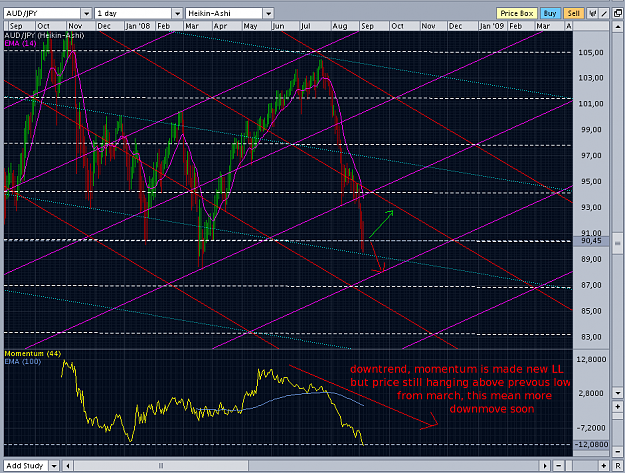
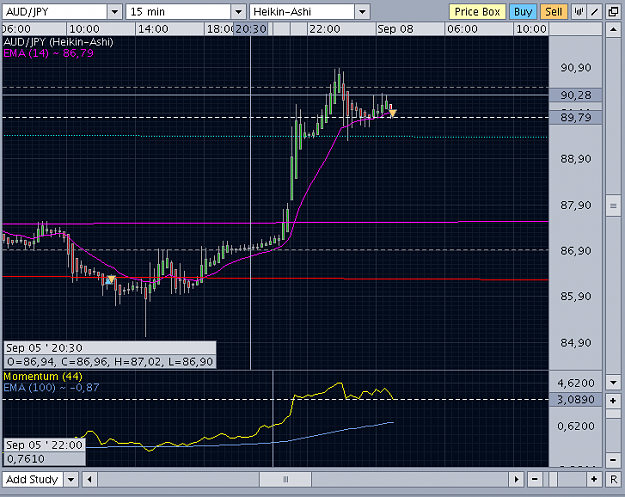
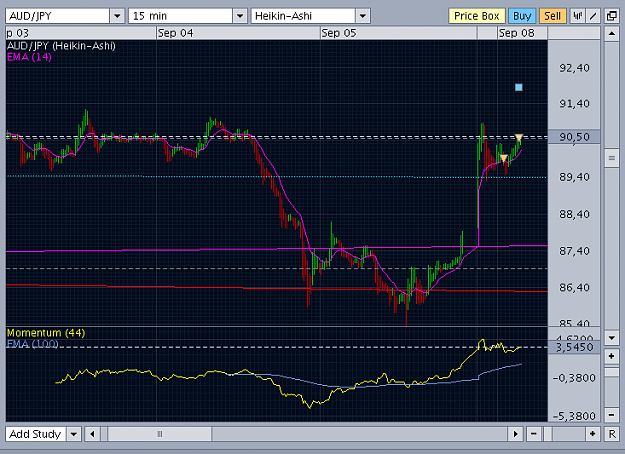
3) AUD/JPY - carry trading
There wasnt occasion to show it since i had joined this forum, frankly speaking i lost on this but recovered very quickly when usd bullrun became a fact
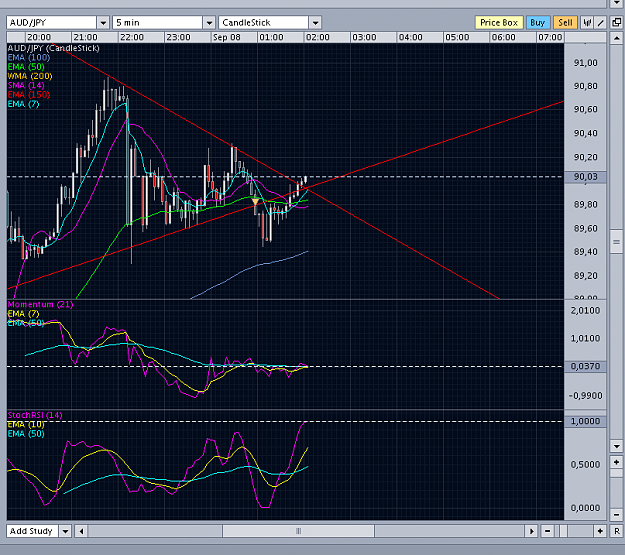
4) Momentum, stochastic and emas based trend continuation entry
my swing technique
Brand new
5) Kaleidoscope map system (gann grid modification)
K-Map
All charts should be self explenatory I believe if wont then just ask me
---------------------------------------------------------------------------------------------------------------------------------------
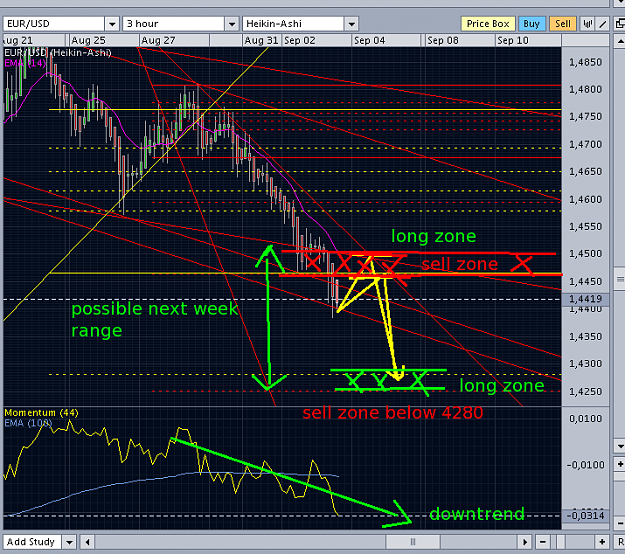
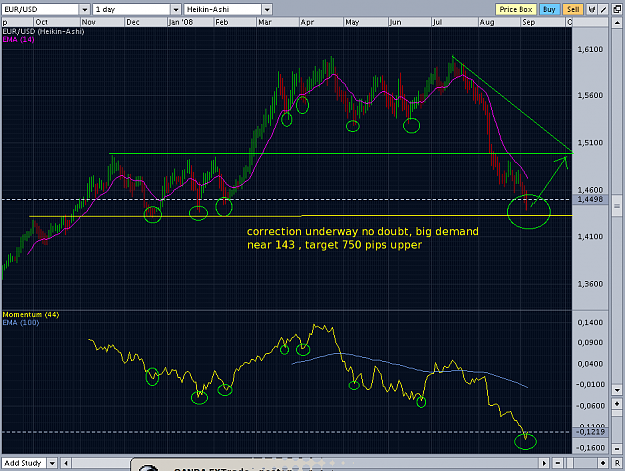
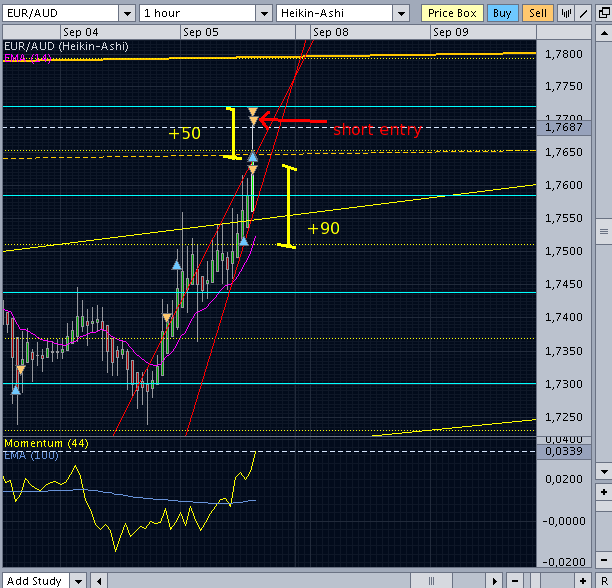
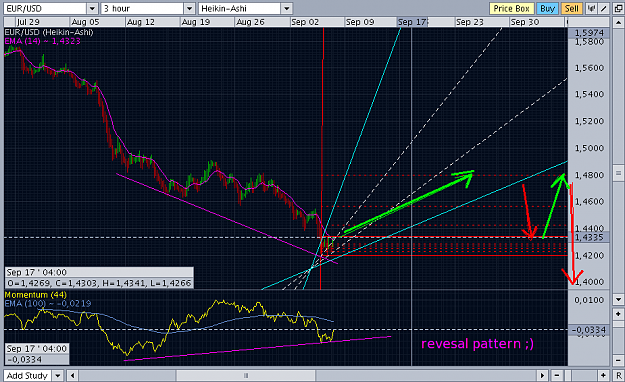
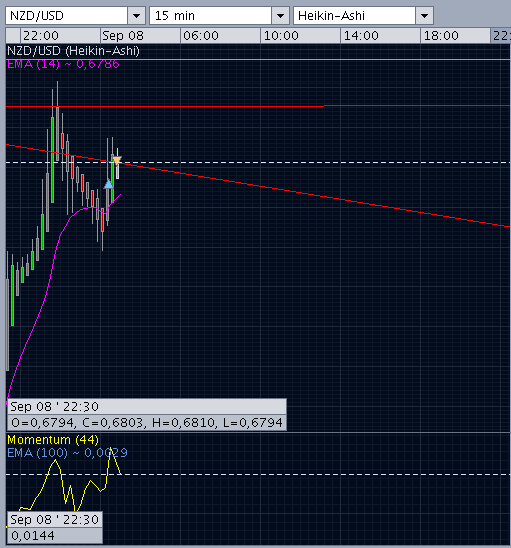
Here we go with first chart showing eur/usd
I used here only EW strategy + momentum + a few trendlines
Red fibo lines respresent lenght of wave 1
Yellow fibo lines represent lenght of wave 3
Purpose of this journal is to share the uncommon knowledge and to fight and win with ego of mine
also I have a short memory so want to keep my ideas alive.
So lets start
I am focusing on a few pairs only from now (3.09.2008):
1) EUR/USD(or USD/CHF) aussie, kiwi - follow the white rabbit style also called equilibrium style. Just love to name stuff into my way.
FTWR
equilibrium style
2) EUR/AUD and SILVER trade with - level trading
level trading
entry/exit explanation
3) AUD/JPY - carry trading
There wasnt occasion to show it since i had joined this forum, frankly speaking i lost on this but recovered very quickly when usd bullrun became a fact
4) Momentum, stochastic and emas based trend continuation entry
my swing technique
Brand new
5) Kaleidoscope map system (gann grid modification)
K-Map
All charts should be self explenatory I believe if wont then just ask me
---------------------------------------------------------------------------------------------------------------------------------------
Here we go with first chart showing eur/usd
I used here only EW strategy + momentum + a few trendlines
Red fibo lines respresent lenght of wave 1
Yellow fibo lines represent lenght of wave 3
Attached Image (click to enlarge)