Joined May 2008
|
Status: Grand Poopaw
|1,488 Posts
Hey Ben,
RedTrader, please forgive for a moment when we get off subject to answer Ben's question.
Go to www.compassfx.com/adr.htm . It's a fabulous deal and gives you lots of info. Updates tick by tick. They have a lot of free videos to teach you how to use it too.... like http://www.compassfx.com/video/flash/70108/70108.html . Look for the archives. The cost of the calculator is about $50. It's worth a look. Big E
Aiya..... If you check back to page 8 and above I explain how I use my Stoch settings. One day while playing with the STOCH SETTINGS i came accross 25,2,3 and put it on top of another Stock of 5,3,3 on the EUR/USD which is one of two currencies I trade. I clicked on properties and unchecked the auto scroll. I went way back and wanted to see if there was any way to use this combination together to find upcoming trades. I liked the 25,2,3 because it was a slow smoothed line as compared to the 5,3,3. To my amazement I began to notice that when 25,2,3 was at the bottom of the channel and 5,3,3 was the same... I could use the 5,3,3 as an entry or exit signal. As 5,3,3 lines crossed up (being on the bottom of it's channel) I saw I could enter a trade. I then noticed as 25,2,3 rose to the top of it's channel, the 5,3,3 would cross over down telling me where to exit. I'VE SEEN THIS 100'S OF TIMES. Regardless of what the Stochastics was originally for, this proved to me to be a reliable set up. As I'm sure you have noticed the 5,3,3 jumps up and down several times during one of my trades. If the 25,2,3 appears that it is losing it's steam before it gets to the top of it's channel... I keep an eye on the 25,2,3 to make sure it's not falling along it's travel upwards. If it looks shakey I look to the 5,3,3 to find an exit (Crossover down). This works for both long or short trades. I stumbled across this forum one day and put in my two cents. End of story. Right, wrong, or ... it works for me and i wanted to share it hoping it would help others. I PREFER THE 1 AND 5 MINUTE CHARTS BECAUSE i like the quick action and it keeps my mind focused so I DON'T LOOSE INTEREST IN TRADING. BIG E
Ignored
one concern I have is that when a pair is strongly trending in one direction we need to be cautious about taking a trade against. the stoch cycles up and down regard of the direction price is trending. there's got to be a way to safe guard against being pulled in the wrong direction.
When you say the 25,2,3 is losing steam, is it a clear reversing cross of the 25,2,3 to determine to exit early or is there anything else you look for that helps decide whether to exit early?
In order to maximize the average pips/day over the long term, I am wondering if it's better to exit early at the first sign the 25,2,3 looks like it is faltering, take the pips, and then look for another setup on a different currency pair. Or are you better off waiting for the 25,2,3 to get to the other side. Just eyeballing the charts it looks like most of the time the 25,2,3 does eventually reach the other side of the channel even if it stalls a bit midway. Just like to know in your experience what you have found works best for you.
Aiya..... If you check back to page 8 and above I explain how I use my Stoch settings. One day while playing with the STOCH SETTINGS i came accross 25,2,3 and put it on top of another Stock of 5,3,3 on the EUR/USD which is one of two currencies I trade. I clicked on properties and unchecked the auto scroll. I went way back and wanted to see if there was any way to use this combination together to find upcoming trades. I liked the 25,2,3 because it was a slow smoothed line as compared to the 5,3,3. To my amazement I began to notice that when 25,2,3 was at the bottom of the channel and 5,3,3 was the same... I could use the 5,3,3 as an entry or exit signal. As 5,3,3 lines crossed up (being on the bottom of it's channel) I saw I could enter a trade. I then noticed as 25,2,3 rose to the top of it's channel, the 5,3,3 would cross over down telling me where to exit. I'VE SEEN THIS 100'S OF TIMES. Regardless of what the Stochastics was originally for, this proved to me to be a reliable set up. As I'm sure you have noticed the 5,3,3 jumps up and down several times during one of my trades. If the 25,2,3 appears that it is losing it's steam before it gets to the top of it's channel... I keep an eye on the 25,2,3 to make sure it's not falling along it's travel upwards. If it looks shakey I look to the 5,3,3 to find an exit (Crossover down). This works for both long or short trades. I stumbled across this forum one day and put in my two cents. End of story. Right, wrong, or ... it works for me and i wanted to share it hoping it would help others. I PREFER THE 1 AND 5 MINUTE CHARTS BECAUSE i like the quick action and it keeps my mind focused so I DON'T LOOSE INTEREST IN TRADING. BIG E
Joined May 2008
|
Status: Grand Poopaw
|1,488 Posts
Aiya, Kudzufx, a777...
Hope I can remember all the questions...lol
I only discovered the 25,2,3 about 6 weeks ago but it's held up so far. I try to stay in the trade all the way from top to bottom or vice versa but don't always feel comfortable doing that. If the 25,2,3 looks like it's slowing down or the angle changes just a little bit (visual perception) I start looking at the 5,3,3 closer as well as reading my candle price action on the chart. If it smells like a rat it probably is! Don't feel bad about jumping out at that time and taking your profits. Another trade set up will be back in a few minutes, believe me. I guess it has to do with risk tolerence which is different for each trader. And trust me I take small losses of 5-7 pips when I'm not paying close enough attention... because you know how fast things happen on the 1 & 5 minute charts if you have ever traded them. Gotta keep my dog out of my trading room and tell the wife only to ask questions when I take a break... that's what usually screws me up.
Through expermintation (sp?) this is how my chart now looks. I put on 1 EMA, shift 3 set at 5 , EMA/close in yellow. I use the line that is the third choice in thickness. I don't like trading on white chart backgrounds because it causes too much wear and tear on my eyes if I'm trading for very long. I like Sky Blue, black or... easier on my eyes. I got that Ema,shift 3 on the close after reading a post from Vantage on another thread.
Most of my trading is done on the EUR/USD as I have posted before... plenty of new trades there besides of the low spreads. Gotta have tight spreads when scalping.
Aiya... I know you play the 1 & 5 minute charts from your posts. I discovered this the other day. HERE IS AN EXAMPLE ON EUR/USD. Put a horizontal line on 1.3600. Put another on 1.3612, 1.3625, 1.3637, 1.3650 etc on and on up and below where price action is at the time. Why? I've noticed on the real low TF's... price will go up and down and hit those levels on a regular basis. Sometimes it will go two lines up or down but it gives you a good feel as to where it is going to hesitate when using your Stoch settings. I thought it was kind of cool when i saw that.
I just took a round number (1.3600) and split it between 1.3600 and 1.3625. You either have to add 12 or 13 for the next line because the difference between the two numbers gives you 12 1/2 which you can't place on your chart. I do about 3-5 horizontal lines on the price before I start trading. It just gives me another visual reference while trading the low TF's.
RedTrader... I apologize for making so many posts. I don't mean to hijack your thread. Please forgive.
Here is my chart set up- LOOK AT THE BEAUTIFUL trade I just missed while typing this reply lol Big E
Joined May 2008
|
Status: Grand Poopaw
|1,488 Posts
Hey guys..
Same chart as above but I want you to look at the trade I highlighted on the left side of this chart please.
NOTE: on the top Stoch indicator (25,2,3) the line is rising up... but it's even below the 50% line! If the line was the face of a clock the arm would be pointing AT ABOUT 2:30 on a clock face...right? No big deal your thinking. Look at the stock below it (5,3,3) Hummm... looks like a possible trade to me. The point is you don't have to take a trade at the top or bottom of the 25,2,3 channel! THE CHART IS SHOUTING AT YOU... look at me, look at me and hear what I'm trying to tell you. In trading your hearing is your eyes and what the chart is so desperately trying to tell you. Listen with your eyes and your mind. Big E
your chart analysis is very impressive, the ability to combine so many peripheral information is something i wish i am able to do.
On your observation with the levels you split on the price channels, i do something similar, but rather i use the previous hour price infomation, ie the high/low and open price and look for any "rubber band" effect within these levels, i belief we are looking at the same level levels but with different interpretation, however that is secondary. Below is a current screen shot of my chart. Its kind of messy, but heres a quick description. The EMAs will point me in the direction to trade, the previous hour high/low will tell me whether it is a breakout or reversal trade, the stochs will trigger my position.
Within this chart there contains several good entries, but 2 are obvious, there is a divergence trade, supported by a flat EMA, signalling a big move coming.
The other one to the right is looks like a pull back to resistant turn support as well as a pull back to 60 EMA, however the stochs saved me from taking a long position as it was trading well below the 50 line.
Attached Image (click to enlarge)
This is only one of my many different trading setups, however have been using this more recently to capitalize on current market conditions.
Joined May 2008
|
Status: Grand Poopaw
|1,488 Posts
Hey Aiya....
Glad to see someone else post...lol.
I only see one short horizontal line on your chart other than the 9,20,60 EMA's. The chart even when enlarged is hard to see...sorry just can't see much.
I'm glad you said something about divergence on your message. Many traders don't know about that. Always means something big is about to happen! Good one.
I'm glad this system is working for you. If you can consistantly make money with it... that's what is important.
RedTrader... I apologize for making so many posts. I don't mean to hijack your thread. Please forgive.
Ignored
Don't worry! And you know why?
Overall, it's about stochastic techniques? Answer: is!
It's experience exchange? Answer: is!
Helps traders to learn/evolve? Answer: I think it does, from what I see
So, there's no problem, keep it on!
P.S. I think we've got a qote from you, on post #170
Joined May 2008
|
Status: Grand Poopaw
|1,488 Posts
Just a clairification from post #169. 5 minute Chart. When I'm talking ABOUT THE HORIZONTAL LINES and how the candles will hit those levels... you need to adjust your candle size (+ or -) until you see them hit those lines. This way you will know in the general area where your candle will top or bottom out. Each line is a 12/13 pip profit or loss. Big E
I also recommend you sign up for the FREE nightly video on the current market conditions at www.compassfx.com on the right side of the page. Hope this helps. Big E
Joined May 2008
|
Status: Grand Poopaw
|1,488 Posts
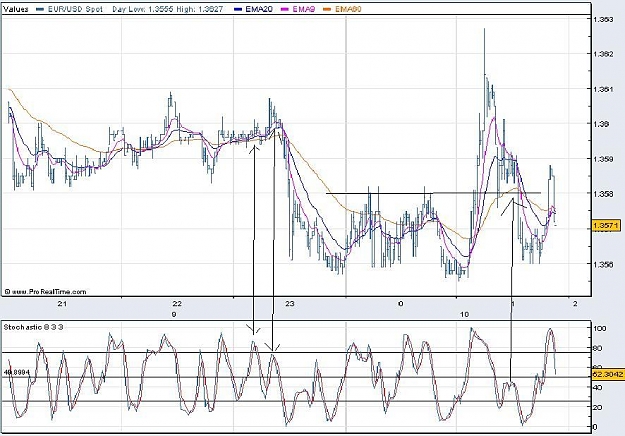
Hi Guys, I've had a few questions about how important the Stoch 25,2,3 is...well...
See on the chart below: Number one trade. The 25,2,3 goes up smoothly but the 5,3,3 looks like... what?. No help for sure. But if you look at the yellow moving average it's going up steady and the candles are on the top side to tell you to stay the trade. Number two trade: Basically the same kind of confirmations but were heading down (short). Big E
Ignored
nice work
after trade # 2 - how do you keep from entering a third trade when the 25 hits the bottom since price continued down?
Joined May 2008
|
Status: Grand Poopaw
|1,488 Posts
Great Question. You can have consolidation on a 15 to ..... minute chart but can normally still trade it in a 1 or 5 minute chart. However here we are already on a 5 minute chart. Look at 25...flat as a dog. Look at the chart, 22 candles pretty flat too right after the second trade. There are always lots of trades using this idea and you don't need to trade them all. Just the last 4-6 candles looked pretty good and I was copying, writing and posting the last post then. As I said... no need to try and trade them all. Besides you loose your sharpness when you hurry, hurry, hurry. I do anyway. I know on the 5 minuter chart I will normally get a chance at 3-5 trades per hour if I so choose.
I try to listen to what the chart is trying to tell me before I place a trade. Are the candles above or below the yellow line, what direction is the yellow line going, what's the daily short term trend off the 4 hour chart , do I see any dojis, pin nails, long tails, railroad,etc in the last couple of candles, Is the market trending at all, Where is the 25 at in it's channel, what's the 5 trying to tell me. If I also use an RSI @14, is it heading up or down...does everything I see confirm a trade? If not I'm out, if so I'm in.
I try to be light hearted about trading... make it fun like a hobby. I don't need the money from trading to live on month to month. If I can't trade that way I'll quit trading. It's just my personality. That doesn't mean I'm not serious as hell about it either. I get a lot less stress this way.
When I first started trading stocks 9 years ago I vowed not to be in the 95% that bites the dust. Those folks feed us I read the other day so he said we always want newbies. It makes sense even though it's grusome (sp?).
I try to be thankful for any winnings, try to learn from any losses/mistakes, try to help others and am always glad to hear when someone else is successful, even if it's only on one trade, 7 pips or 100. And daily I take an hour or so trying to improve my trading style/set ups.