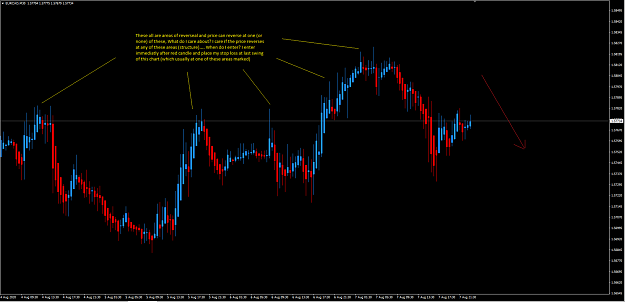
I trade with only one indicator at the chart which is the Synergy_APB candles (similar to heikenn ashi candles but they are different ) and that's it. nothing else.
Before the start of the week I will choose one pair and one pair only to trade it for the entire week. at the end of the week (Friday night) I will assess my chosen pair either to take profit or continue working with the pair for additional week. and so on. I try my best to work with one pair (or one basked of similar pairs).
I am interested in the daily move (swings) however, I try to look at all time frames for the pair I am working on.
So these time frames I look at
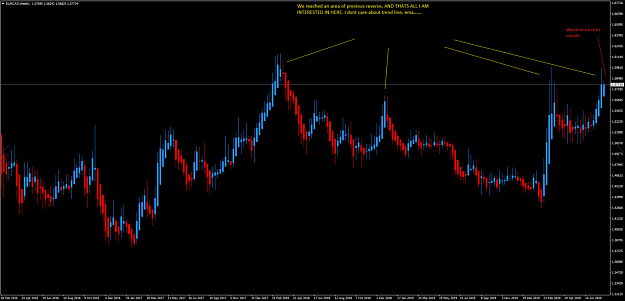
1- Monthly- weekly: depending where the price is at in these charts this tells me whether I will be working on that pair for a week or more.
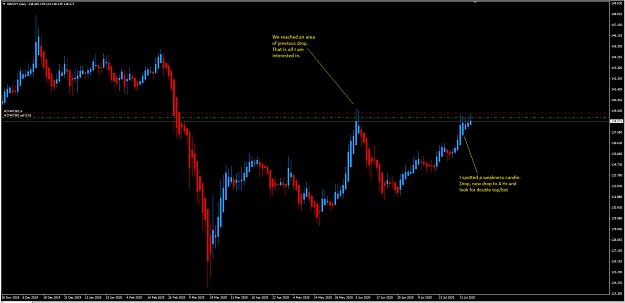
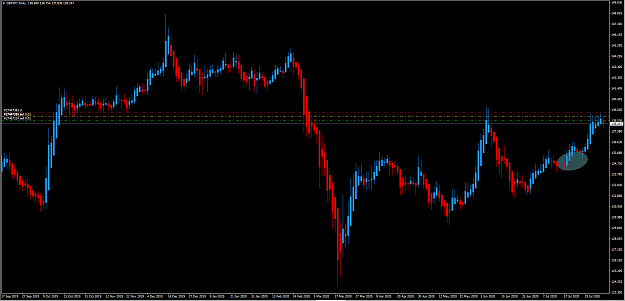
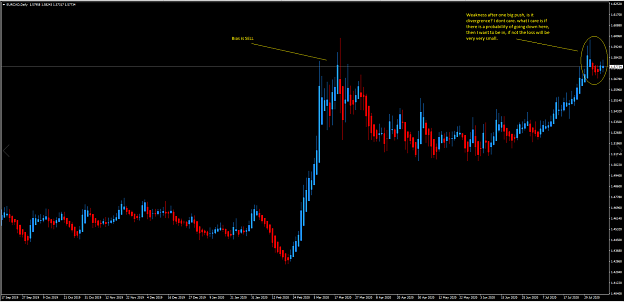
2- Daily: Here I look for my bias (buy or sell), I am interested only for prices reaching previous reversal areas. (pretty easy to spot)
3- 4Hr: After spotting the reversal area I look here for double top/bottom (or divergence)
4- 30min-15min: Here is where my entry chart is, this charts only for entries and placement of risk (SL) ( I currently dont do this manually, I have already setup VPS EA to do the entries for me)
So since I dont really have to do the entries manually I just glance at my chart once a day.

